
Ethereum price analysis: the double top, the levels, and ETH against Bitcoin
On this page
Summary
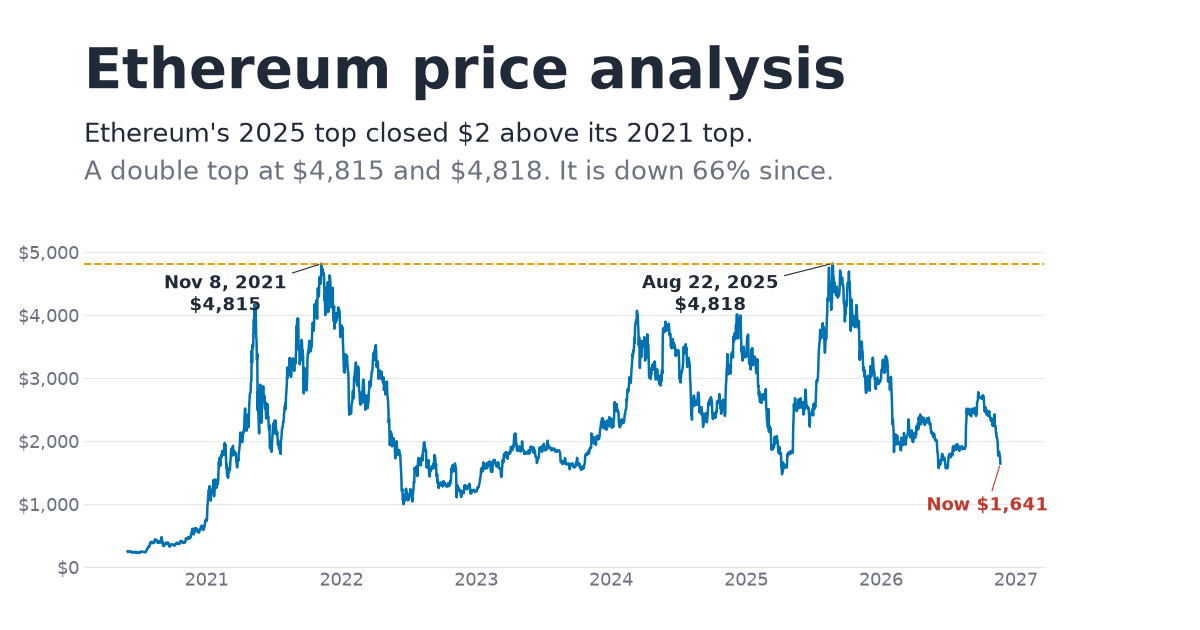
As of November 20, 2026 (17:00 UTC), Ethereum trades at $1,641, a market cap of $200.6B on CoinGecko's supply of 122.2M ETH. It is down 6.5% today, 66% below its all-time high close of $4,817.76 (August 2025), and 4.8% above its June 2026 low of $1,566.
This Ethereum price analysis uses the same method as my XRP one. Three things shape how I read Ethereum from here:
- It made a near-exact double top. The 2025 high closed at $4,817.76, $2.28 above the 2021 high of $4,815.48. Market cap did the same: $579B against $561B. Unlike XRP, Ethereum's supply barely grew between the two tops, so price and market cap tell the same story.
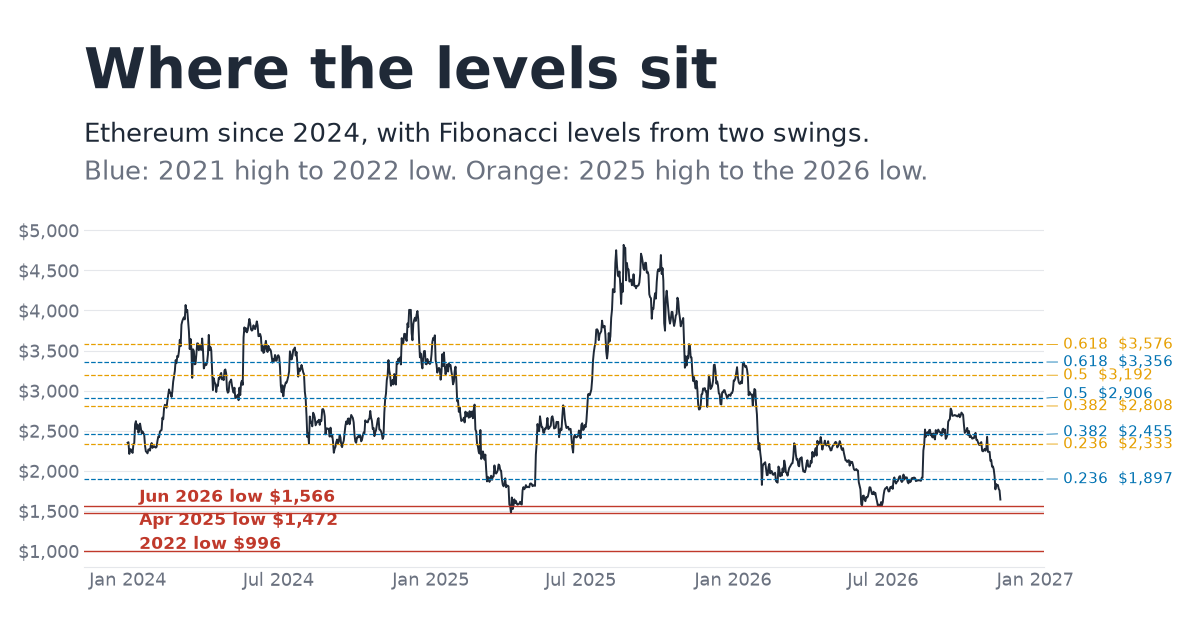
- The levels. Resistance above: $1,897 and $2,333-$2,455, the first Fibonacci levels from two swings. Support below: the June 2026 low at $1,566, the April 2025 low at $1,472, and the 2022 low at $996.
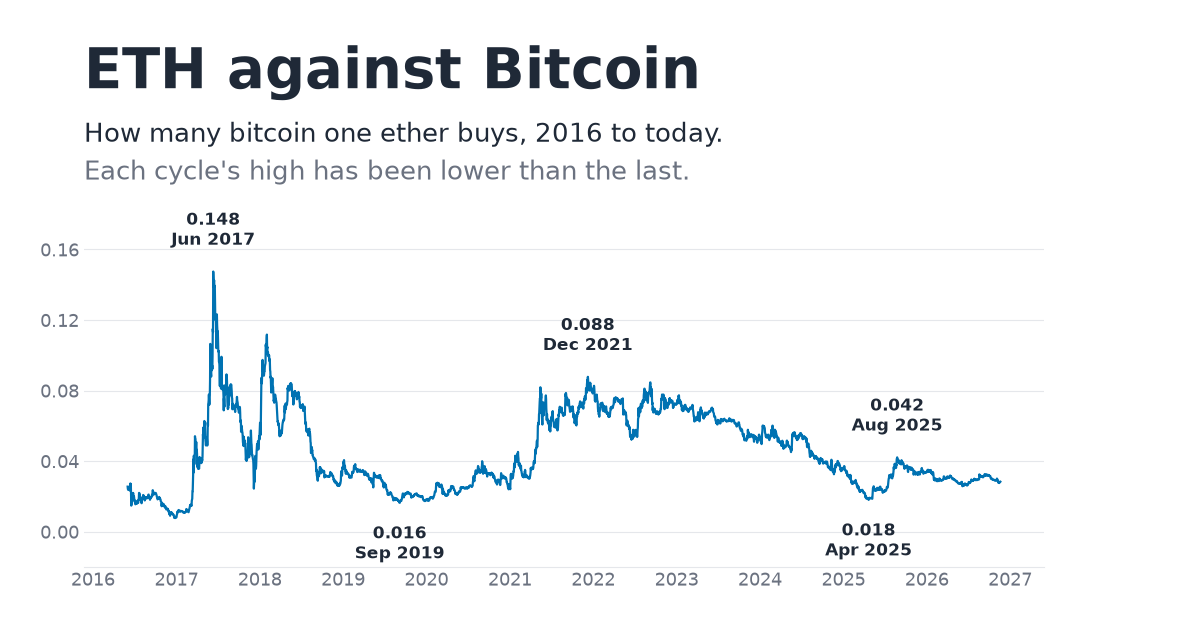
- ETH against Bitcoin is the weak spot. At each cycle's peak, one ETH bought half to six-tenths as much Bitcoin as the time before: 0.148 BTC in 2017, 0.088 in 2021, and 0.042 in 2025. In the last bull market, ETH lagged Bitcoin instead of leading it.
This is history and arithmetic, not a forecast.
The double top: 2021 against 2025
| Top | Close | Market cap | Supply |
|---|---|---|---|
| November 8, 2021 | $4,815.48 | $561B | 118.7M ETH |
| August 22, 2025 | $4,817.76 | $579B | 121.0M ETH |
| November 20, 2026 (now) | $1,641 | $200.6B | 122.2M ETH |
Ethereum spent four years getting back to its 2021 high, closed 0.05% above it, and then fell 66%. A second top at almost exactly the first is about as clean a double top as a large asset gets.
The 2021 top had its own precision. In the XRP price analysis I showed that Ethereum's 2021 market cap topped at $561B, on the 4.236 Fibonacci extension of its 2018 swing ($551B). Measured from the 2021 swing instead, the 2025 market-cap top landed 3% above that swing's level 1, the old high. So the market cap told the same story as the price.
Why price and market cap match for ETH. XRP's supply grew 64% between its 2018 and 2025 tops, so the same price meant a much bigger market cap. Ethereum's supply grew about 2% between its two tops (118.7M to 121.0M), and about 3% to today's 122.2M. For ETH, a price level and a market-cap level are almost the same line.
Get the daily brief
One email each morning: the day's biggest price movers and a short read on the market.
Double opt-in. Unsubscribe in one tap.
Ethereum's key price levels
The table shows Fibonacci levels from two swings, the levels that have acted as support and resistance, with each level's market cap at today's supply. Swing 1 runs from the 2021 high to the 2022 low; swing 2 from the 2025 high to the June 2026 low.
| Level | Swing 1: 2021 high ($4,815) to 2022 low ($996) | Market cap | Swing 2: 2025 high ($4,818) to June 2026 low ($1,566) | Market cap |
|---|---|---|---|---|
| 0.236 | $1,897 | $232B | $2,333 | $285B |
| 0.382 | $2,455 | $300B | $2,808 | $343B |
| 0.5 | $2,906 | $355B | $3,192 | $390B |
| 0.618 | $3,356 | $410B | $3,576 | $437B |
| 0.786 | $3,998 | $489B | $4,122 | $504B |
| 1 | $4,815 | $589B | $4,818 | $589B |
| 1.618 | $7,176 | $877B | $6,827 | $835B |
| 2.618 | $10,995 | $1,344B | $10,079 | $1,232B |
Resistance above
Above today's price, the first level is $1,897 (swing 1's 0.236), then a cluster at $2,333-$2,455, where swing 2's 0.236 and swing 1's 0.382 sit close together.
ETH spent most of mid-2026 between $1,566 and $2,775. Its September high of $2,775 stopped just under swing 2's 0.382 ($2,808).
Support below
Below, the levels are prior lows and retracements of the whole 2022-to-2025 rise:
| Level below | Price |
|---|---|
| June 25, 2026 low | $1,566 |
| April 8, 2025 low | $1,472 |
| 0.886 retracement of the 2022 low to 2025 high | $1,432 |
| June 18, 2022 low (a full retracement) | $996 |
ETH is already below the 0.786 retracement of that rise ($1,814). Most of the rise from the 2022 low has been given back.
Ethereum vs Bitcoin: the ETH/BTC ratio
For an altcoin, the price against Bitcoin matters as much as the price in dollars. It is how you tell an alt rally from a rising market.
| ETH/BTC | |
|---|---|
| June 2017 peak | 0.148 |
| September 2019 low | 0.016 |
| December 2021 peak | 0.088 |
| April 2025 low | 0.018 |
| August 2025 high | 0.042 |
| Now | 0.028 |
Each peak has been half to six-tenths of the one before. The same thing shows up around Bitcoin's reclaim of its old high, the window I used in the XRP article and the market breadth article:
| Cycle | From Bitcoin's reclaim of its old high to its top | ETH | BTC | ETH against BTC |
|---|---|---|---|---|
| 2017 | Jan 4 to Dec 16, 2017 | x72.04 | x19.61 | x3.67 |
| 2021 | Dec 17, 2020 to Nov 9, 2021 | x7.37 | x2.94 | x2.51 |
| 2024-25 | Mar 5, 2024 to Oct 7, 2025 | x1.25 | x1.90 | x0.66 |
In 2017 and 2021, ETH led the alt market after Bitcoin's new high. In 2024-25 it trailed Bitcoin, which is part of why the alt market never broadened. If breadth comes back to crypto, I would expect to see it in ETH/BTC first.
What Ethereum has going for it and against it
The case for Ethereum
- It is where the stablecoins and tokenized assets are. Ethereum holds about 46% of all stablecoins, $132B on November 16, 2026, against 33% on Tron and 5% on Solana (DefiLlama, via Stablecoin Insider). That doesn't count Ethereum's layer-2 networks.
- Usage is growing. Mainnet transactions were up 54% in the first ten months of 2026 from a year earlier, and layer 2s run about ten times mainnet's volume (Coindoo).
- A third of all ETH is staked: 44.2M ETH, 36% of supply, up from 28% a year earlier (same source). Spot ETH ETFs can now stake too: Grayscale switched it on in October 2025 (The Block).
- Upgrades are shipping. Pectra went live in May 2025 (The Block) and Fusaka in December 2025, raising layer-2 data capacity. The next upgrade, Glamsterdam, has no confirmed date.
- One big holder. BitMine held 6.08M ETH on November 15, 4.97% of all ETH, 86% of it staked (The Block).
The case against
- ETH is inflating again. Supply grew 0.72% in 2025 and about 0.8% a year in 2026, about Bitcoin's rate, after shrinking in 2023 (ultrasound.money, via Coindoo). Fees fell so far that the burn now offsets under 3% of new issuance. Mainnet fees in the first ten months of 2026 were 58% lower in ETH than a year earlier.
- Cheaper scaling means less revenue for ETH. Layer 2s paid Ethereum about $113M in 2024 and about $10M in 2025 (growthepie, via CryptoSlate).
- The ETFs are selling. October 2026 was the worst month since launch, with $1.6B of net outflows, and $2.35B left over the seven weeks to November 12 (Crypto Briefing).
- The biggest buyer is near its limit. BitMine has called 5% of supply its cap and is at 4.97%, and its weekly buying has slowed.
None of that changes the arithmetic above. More usage at lower fees can be good for users and bad for the token, which is the question I tested in Does anyone have to buy your token?.
What to watch next
- Watch $1,566 first. That is the June 2026 low; ETH is 4.8% above it. Below it, $1,472 and $1,432 sit close together.
- Above, $1,897 and $2,333-$2,455 are the first levels. ETH failed just under $2,808 in September.
- Watch ETH/BTC, not just the dollar price. A rising ETH/BTC is the first sign of the breadth that 2017 and 2021 had and 2024-25 didn't.
- What would change this view. On the upside: ETH/BTC back above its August 2025 high of 0.042, and a close above $2,808, where September failed. On the downside: a close below $1,432, which would leave the 2022 low at $996 as the next major level.
- Expect most levels to be missed. Few cycle tops land on a level as precisely as Ethereum's did; I counted how few in the XRP article.
Ethereum's coin page has its live chart, risk grade and Quality score, the Altcoin Season Index tracks how many of the top 50 alts are beating Bitcoin each day, and more analysis is in our Learn section.
How I measured
- Data. Daily closes and market caps from CoinGecko, full history, pulled November 20, 2026. CoinGecko stamps each day at 00:00 UTC with the previous day's close, so I shift each stamp back one day. "Now" is CoinGecko's price at 17:00 UTC on November 20.
- Closes, not wicks. Intraday highs were higher than closes, so wick-based charts give different levels.
- Fibonacci levels are linear: level = low + k x (high - low). Market caps at each level use today's supply of 122.2M ETH.
- Market-cap highs and lows use a 3-day median to drop single-day data glitches.
- ETH/BTC is ETH's daily close divided by Bitcoin's on the same day.
FAQ
What is Ethereum's price today?
$1,641 at 17:00 UTC on November 20, 2026, down from $1,756 at the November 19 close. That is 4.8% above the June 2026 low of $1,566, the nearest support.
What is Ethereum's all-time high?
On daily closes, $4,817.76 on August 22, 2025, which beat the November 8, 2021 close of $4,815.48 by $2.28. Intraday highs were higher.
Why is Ethereum down?
It is 66% below its all-time high. Supply is growing again because fees fell too low for the burn to offset issuance, spot ETH ETFs had their worst month on record in October 2026, and the biggest corporate buyer is near its 5% cap. ETH has also lagged Bitcoin: each cycle's ETH/BTC peak has been lower than the last.
Did Ethereum make a double top?
Yes, almost exactly. It closed at $4,815.48 on November 8, 2021 and at $4,817.76 on August 22, 2025, then fell 66%. Its market cap topped at $561B and $579B.
What are Ethereum's support and resistance levels?
Resistance: $1,897, then $2,333 to $2,455, the first Fibonacci levels from the 2021 and 2025 swings. Support: the June 2026 low at $1,566, the April 2025 low at $1,472, then $1,432 and the 2022 low at $996.
Will Ethereum go back to $4,800?
I don't forecast it. The level has stopped two tops. At today's supply, $4,818 is a $589B market cap. In past cycles ETH's biggest runs came after Bitcoin made a new high, and in the last cycle ETH lagged Bitcoin even then.
Why is ETH weak against Bitcoin?
Each cycle's ETH/BTC peak has been half to six-tenths of the last: 0.148 in 2017, 0.088 in 2021, 0.042 in 2025. In 2024-25 ETH trailed Bitcoin after Bitcoin's new high instead of leading it. Supply growing again, falling fees and ETF outflows have all weighed on it.
Is Ethereum deflationary?
Not now. Supply shrank 0.29% in 2023, then grew 0.72% in 2025 and about 0.8% a year in 2026, because fees fell too low for the burn to offset new issuance.
Where Cyclesolved fits
Every coin page shows its Quality score (how established and how widely traded the coin is), its risk grade, and every metric we read across technicals, on-chain, fundamentals, sentiment and macro, with the reading behind each one.
Start here:
No ads. No calls. No hype. No paid coin promotions, ever.
Data provided by CoinGecko
Not financial advice. Educational only.
Get the daily brief
Ethereum's Quality score and risk grade, BTC dominance and the day's biggest movers. One email each morning.
Double opt-in. Unsubscribe in one tap.
See this on real coins
Every coin in the top 300, ranked by its Quality score, with its risk grade and every metric's reading.