
Market breadth and crypto: why 2025 hurt altcoins, and what comes next
On this page
Summary
In 2025 the S&P 500 rose 16%. Bitcoin fell 6%, and the median top-30 altcoin fell 51%. Only 6 of those 30 coins beat Bitcoin.
If stocks were up and crypto investors still lost money, the obvious question is why. My answer is market breadth: how many stocks or coins actually take part in a move. A broad market rises on most of its members; a narrow one rises on a few giants.
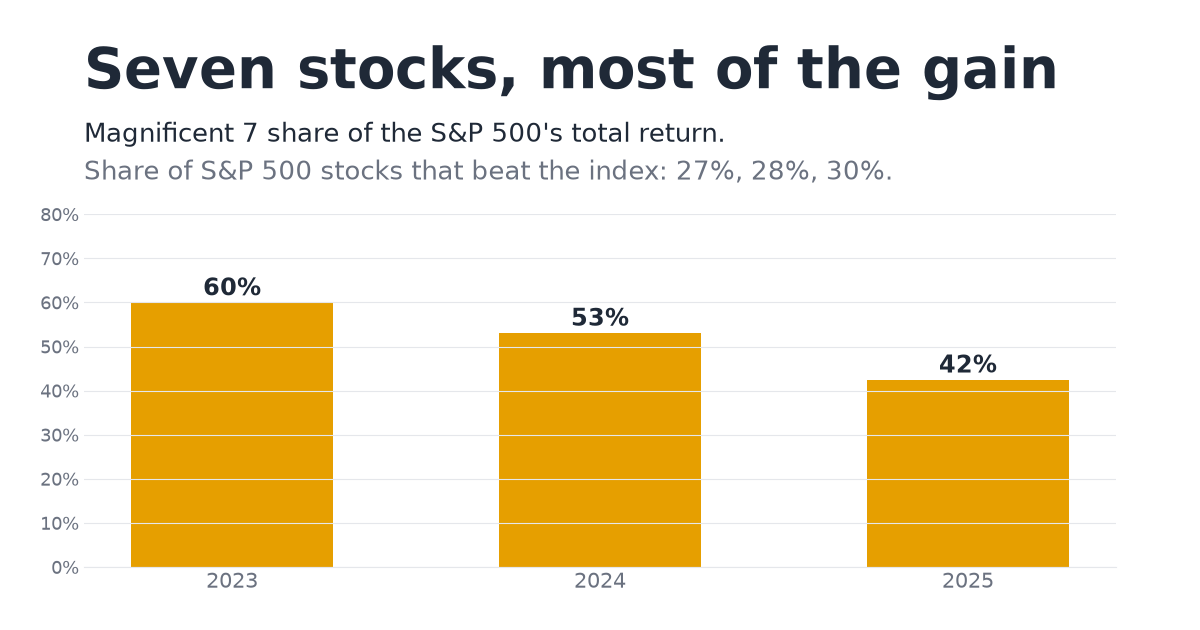
- The stock market was the most concentrated in decades. The 10 largest companies reached about 40% of the S&P 500. The Magnificent 7 made about 60% of the index's gain in 2023, 53% in 2024 and 42% in 2025. Only about 3 in 10 stocks beat the index each year.
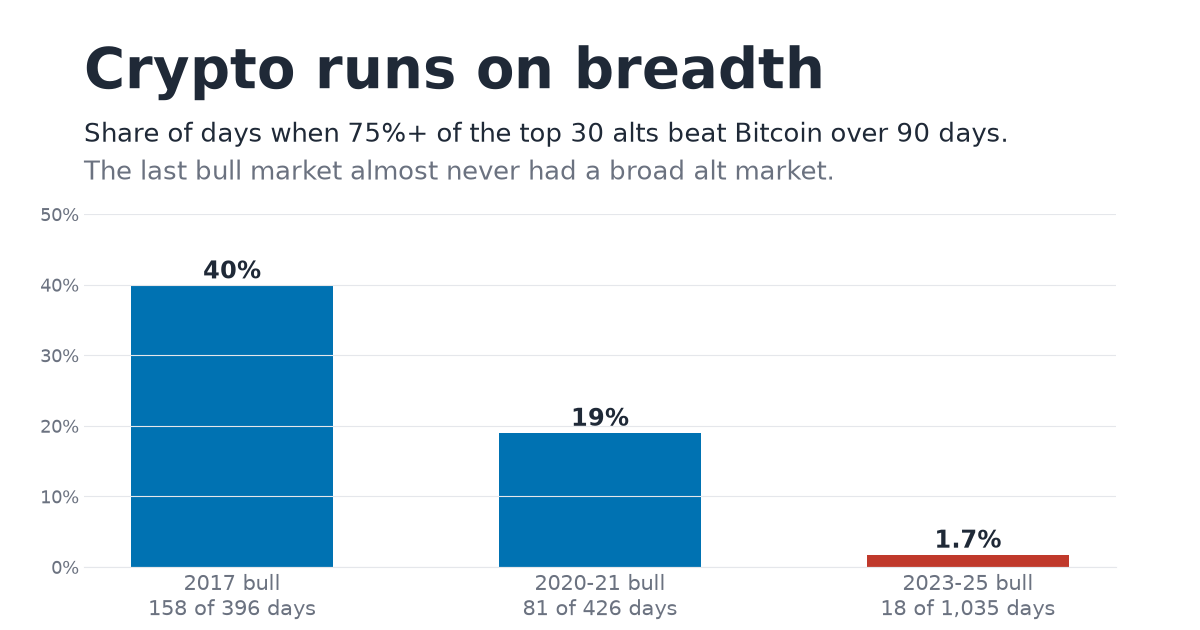
- Crypto had the same problem. Bitcoin dominance, its share of the crypto market, rose from 39% to 64%. In the 2023-25 bull market, a broad alt market (three-quarters of the top alts beating Bitcoin) showed up on 18 of 1,035 days. In 2017 it was 158 of 396.
- Narrow markets don't stay narrow. After the 1973 and 2000 tops, leadership spread out for years. That shift may have started in October, when the average S&P 500 stock beat the index by the most since 2009. NVIDIA, the stock that carried the market, has since fallen 39% from its record.
The first three sections are data. The last section is my view, and I label it that way.
The narrowest stock market in decades
"Breadth" is how many stocks take part in a move. A broad market rises on most of its stocks. A narrow one rises on a few big ones while the rest go sideways or down.
The last three years were narrow by almost any measure:
| 2023 | 2024 | 2025 | |
|---|---|---|---|
| S&P 500 total return | 26.3% | 25.0% | 17.9% |
| Magnificent 7 share of that return | about 60% | 53% | 42% |
| S&P 500 stocks that beat the index | 27% | 28% | 30% |
| Equal-weight S&P 500 vs the normal index | about -12 pts | about -12 pts | about -5 to -7 pts |
Sources: S&P Dow Jones Indices and WisdomTree for 2023, S&P Dow Jones Indices for 2024, First Trust for 2025; share beating the index from First Trust and S&P Dow Jones Indices.
Over 2023-25 together, the normal S&P 500 returned about +86% and the equal-weight version about +43%, the widest three-year gap since 1971 (Motley Fool). Small caps (the Russell 2000) trailed large caps (the Russell 1000) for eight calendar years in a row through 2024 on Royce's index figures (2020 by a fraction of a point), the longest run since both indexes began (Royce), and trailed the S&P 500 again in 2025.
The concentration itself:
- Top 10 share of the S&P 500: about 19% around 2015, 23% at the end of 2022, and 39.9% at the end of 2024. At the 2000 dot-com peak it was about 27% (Schwab, via TheStreet).
- Across the whole US market, the top 10 reached 37.7% in October 2025, above the old record of 37.3% set in May 1932 (Morningstar). Some long datasets show the mid-1960s higher still, so "most concentrated since the 1930s" is the safe claim, not "ever".
NVIDIA was the center of it. It made more than 22% of the S&P 500's return in 2024 (S&P Dow Jones Indices, via Voronoi) and about 15% in 2025, the most of any stock (First Trust). It was the first company worth $4 trillion in July 2025 (AP) and the first worth $5 trillion that October (AP), and it passed 8% of the index, the largest single-stock weight in decades (Benzinga).
Get the daily brief
One email each morning: the day's biggest price movers and a short read on the market.
Double opt-in. Unsubscribe in one tap.
Crypto had its own Magnificent 7: Bitcoin dominance
The same thing happened inside crypto. The money stayed at the top.
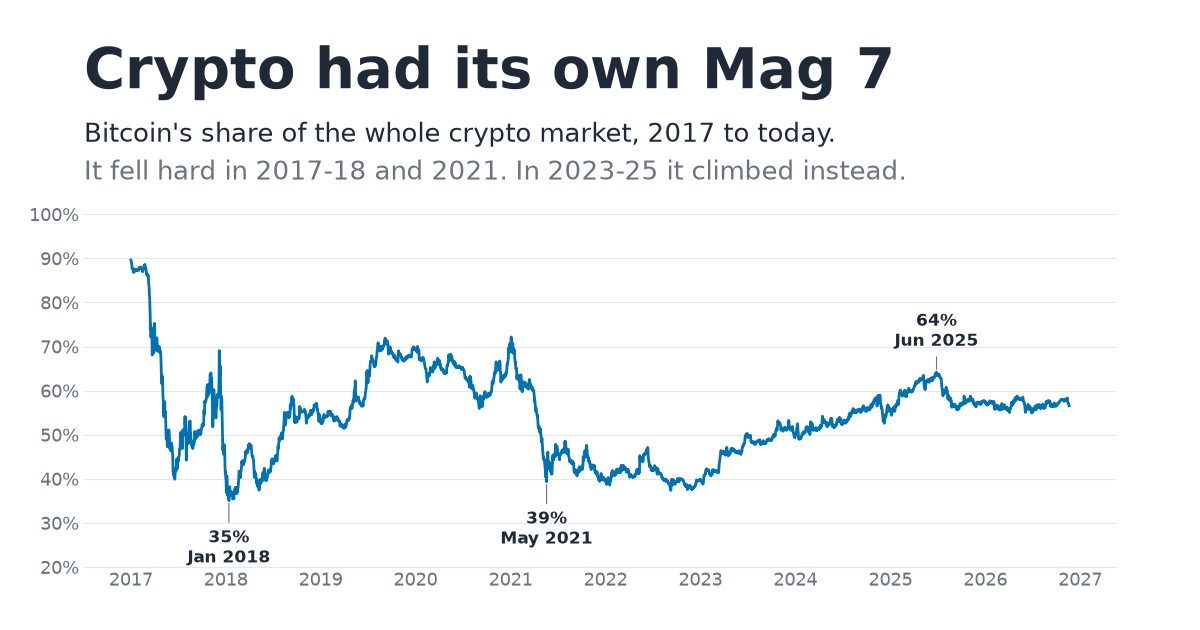
Bitcoin dominance, its share of the whole crypto market, fell to 35% at the 2018 alt peak and to 39% in May 2021. In the last cycle it went the other way: from 39% in January 2023 to 64% in June 2025. After Bitcoin passed its old high in March 2024, its share never fell below 52%.
I measured alt breadth directly: on each day, the share of the 30 largest altcoins that beat Bitcoin over the previous 90 days.
| Bull market | Median breadth | Days with a broad alt market (75%+) | Alts that beat BTC over the whole run |
|---|---|---|---|
| 2017 | 43% | 158 of 396 | 24 of 28 |
| 2020-21 | 37% | 81 of 426 | 13 of 30 |
| 2023-25 | 27% | 18 of 1,035 | 6 of 30 |
On the median day of the 2023-25 bull market, 73% of the top alts were losing to Bitcoin. Its whole-run result, 6 of 30, matches what I found on a different set of coins in the XRP price analysis: 6 of 23.
Then 2025, the year that made this obvious:
| 2025 | Return |
|---|---|
| S&P 500 (price) | +16.4% |
| Nasdaq (price) | +20.4% |
| Bitcoin | -6% |
| Median top-30 altcoin | -51% |
| Total alt market cap (ex BTC, ex stablecoins) | -19% |
Stock market figures from Reuters (via MarketScreener); crypto figures are mine, from CoinGecko daily closes. Bloomberg called it the first year since 2014 that stocks rallied while Bitcoin fell.
Why stock breadth matters to crypto
Crypto has never had a bull market without a healthy stock market. Every crypto run in the data came with strong stocks: in 2017 the S&P 500 never fell more than about 3% from a high (S&P Dow Jones Indices), and in 2020-21 it had its fastest doubling since World War II (Axios). And when stocks fall, altcoins fall harder every time. Bitcoin usually does too:
| Stock drawdown (the S&P 500's own peak and trough dates) | S&P 500 | Bitcoin | Median top-30 alt |
|---|---|---|---|
| Q4 2018: Sep 20 to Dec 24, 2018 | about -20% | -38% | -50% |
| COVID crash: Feb 19 to Mar 23, 2020 | -34% | -33% | -44% |
| 2022 bear market: Jan 3 to Oct 12, 2022 | about -25% | -59% | -72% |
| Oct 6 to Nov 19, 2026 | -8% | -26% | -37% |
The crypto figures run close to close on the same dates as the S&P. In the COVID crash Bitcoin fell about as much as stocks did; the alts still fell more. Bitcoin's own highs and lows came on different days, so measured from its own peaks its falls were deeper.
But 2025 shows a strong market isn't enough on its own. What crypto needs is risk appetite that reaches past the biggest names. Look at the start of the 2021 alt season. In the fourth quarter of 2020, small caps had their best quarter in the Russell 2000's 40-year history, up 31.4% (Royce). Speculative money was spreading out, and a few months later it reached the alts.
In 2023-25 it never did. The money went into seven stocks and one coin. Investors who wanted growth bought NVIDIA, not small caps or altcoins.
I should be fair about the limits here. Calendar-year stock breadth doesn't line up neatly with crypto: in 2017 the equal-weight S&P trailed the normal index by about 3 points while alts had their best year ever. The day-to-day link between Bitcoin and stocks is also young: the IMF measured it at 0.01 for 2017-19 and 0.36 for 2020-21 (IMF). What lines up clearly is the last cycle: narrow in both markets, at the same time.
How narrow markets end
History has three famous narrow tops: 1929, 1973 and 2000. They share a pattern, and it isn't "everything goes up together, then crashes".
1929. The leaders of 1924-29 were concentrated: radio, airplanes, utilities and General Motors gained many times more than the market. From March 1928 the public poured in. Broker loans reached $8.5 billion by October 1929 (FRASER). Hundreds of new investment trusts sold about $3 billion of shares in 1929 alone (John Kenneth Galbraith, The Great Crash), and closed-end funds traded around 50% above the value of what they held (De Long and Shleifer). The leaders' gains were being sold to a widening crowd.
Underneath, though, the average stock had already turned. An equal-weighted index peaked in February 1929 while a few blue chips (US Steel, General Electric, AT&T) carried the Dow to its September top (Rappoport and White, NBER; Frederick Lewis Allen, Only Yesterday). A crowded top on top of a weakening average stock: that is the 1929 signature.
2000. The same shape. The NYSE advance-decline line peaked in April 1998, two years before the top. In 1999 the public piled into new issues: 446 IPOs with an average first-day gain of 71% (Jay Ritter, via PBS).
What came after is where breadth returned. After 1929 it took the 1932 bottom: in the crash, small stocks fell even harder than the leaders. After 1973 and 2000, breadth came back while the leaders were still falling:
- After 1973: the Nifty Fifty leaders broke. Polaroid and Xerox lost most of their value. MFS, studying past concentration peaks including 1973, found that afterwards equal-weighted stocks beat the cap-weighted market, small caps beat large caps and value beat growth (MFS, via Firstlinks). Small caps returned about 35% a year against 16% for large caps from 1975 to 1983 (Siegel, via A Wealth of Common Sense).
- After 2000: Cisco, briefly the world's most valuable company, lost most of its value. Across 2000-2007, small value stocks returned +215% while the S&P 500 returned +14% (Larry Swedroe).
- Over long periods: since 1964, the other 490 stocks beat the top 10 in 88% of five-year periods when concentration was in its highest third (CFA Institute).
Two cautions. First, "breadth returning" often started as the rest of the market falling less, not rising. Second, concentration can last a long time: the top 10 stayed above about 25% of the US market from the 1920s into the 1960s (Morningstar).
The unwind may have started
NVIDIA. NVIDIA closed at a record of about $239 on October 6, 2026, worth about $5.8 trillion (Motley Fool). By November 19 it was $145.98, down 39%. Apple passed it as the largest company on October 30 (Yahoo Finance).
The headlines blamed the CEO. Jensen Huang resigned on November 12 (SEC filing) after reports about his personal conduct and a board investigation. But the price was falling first:
- 23% of the drop came before the first scandal report on October 29.
- 70% came before he resigned.
- On November 5 the chip index fell 12%, its second-worst day ever, on no NVIDIA news (24/7 Wall St).
- On November 17 NVIDIA reported revenue up 103% from a year earlier, beating estimates (SEC filing). The stock fell anyway.
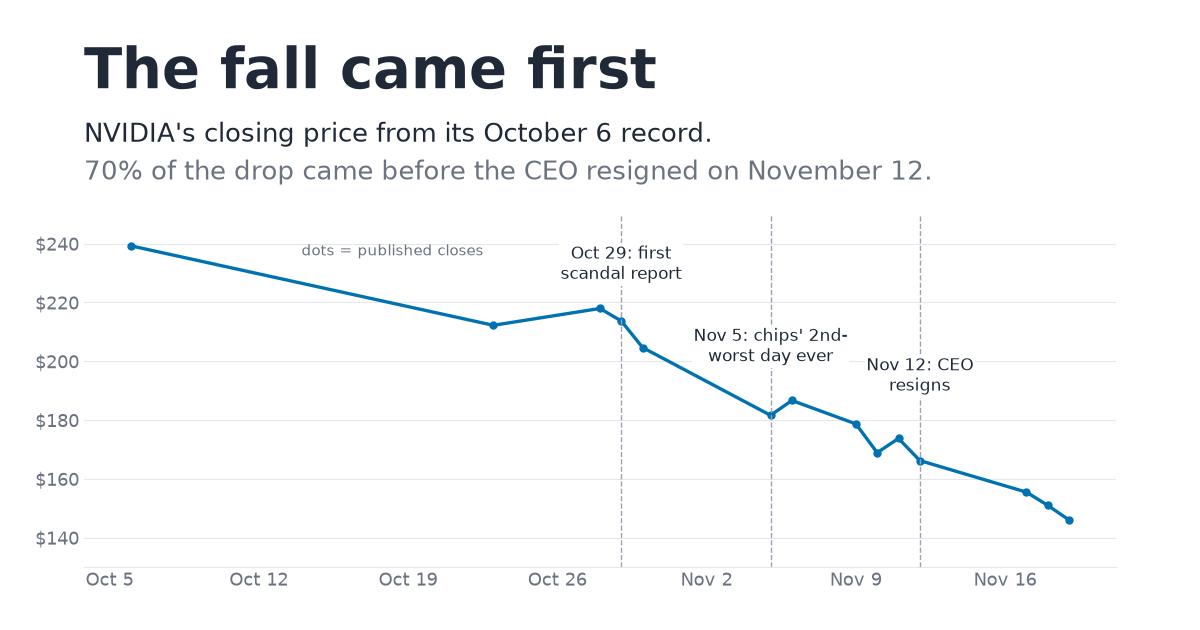
The scandal probably made some days worse. But a stock that falls while its business doubles is a stock that was crowded.
Where the money went. In October it went to the rest of the market. The equal-weight S&P 500 gained about 5% while the normal index lost about 1%, the biggest monthly gap in the average stock's favor since 2009 (24/7 Wall St). Consumer staples, energy, utilities and health care led. Hedge funds sold tech at the fastest pace in a decade, on Goldman Sachs' prime brokerage data (24/7 Wall St).
That fits a pattern that had been building all year. Equal weight had its strongest start against the normal index since 1992 (Nationwide), and in the third quarter the Magnificent 7's earnings grew more slowly than the other 493 companies' for the first time since 2022: 22.6% against 32.6% (FactSet).
In November the selling spread. The S&P 500 is down about 5% this month and 8% from its October 6 record. Gold is near a one-year low, Treasury yields have risen, and spot Bitcoin ETFs lost about $2.35 billion over 11 straight days of outflows (Cointelegraph). For now most of the money is going to cash.
What breadth coming back could mean for crypto: my view
This section is my opinion, not a finding.
I think we're in the early stage of the same handoff that followed 1973 and 2000. The market spent three years paying for one theme. When that theme stops working, the money doesn't disappear. It goes looking for what hasn't run yet. In stocks that has meant small caps, value and the average stock. In crypto it has meant altcoins, which spent three years as the market's leftovers.
I also think crypto has catching up to do. Bitcoin topped a full year before stocks did, and it has fallen about half from that top while the S&P 500 is down 8% from its own. In 2021 and 2024, gaps like this closed with crypto catching up. In 2018 and early 2020 they closed with stocks falling to meet crypto, and that's what has happened so far this time. The catch-up usually needed a trigger. I don't know what this one will be.
What I'm watching:
- The equal-weight S&P 500 against the normal one. If the average stock keeps beating the index, breadth is coming back.
- Small caps against large caps. That is where speculative money shows up first.
- Our Altcoin Season Index, which tracks how many of the top 50 alts beat Bitcoin, live. It needs 75 to call an alt season. As of November 19, its highest reading in the past year was 68.
- Bitcoin dominance. In every past alt season it fell hard. It was 56.5% on November 19, measured as Bitcoin's market cap over CoinGecko's total crypto market cap. Sites that leave out stablecoins show a higher number.
How I measured
- Crypto data. CoinGecko daily closes and market caps, full history, pulled November 20, 2026, for 110 altcoins plus Bitcoin. I deliberately included coins that have since faded or died (NEM, Lisk, Steem, BitShares, Terra Classic, FTX Token and others) to reduce survivorship bias. Stablecoins are excluded.
- Alt breadth. On each day, I take the 30 largest coins in that set by market cap on the first day of the 90-day window and count how many beat Bitcoin's 90-day return. A coin with no price at the end counts as losing. The set is still hand-picked, not a full historical top 30, so it leans toward survivors, most of all in 2017. Baskets of 20 and 50 coins give the same order.
- Bull market windows. 2017: January 1, 2017 to January 31, 2018. 2020-21: October 1, 2020 to November 30, 2021. 2023-25: January 1, 2023 to October 31, 2025.
- Bitcoin's share is Bitcoin's market cap divided by CoinGecko's total crypto market cap. One glitched day (February 20, 2026) is left out of the chart.
- Stock figures are published numbers, linked to their sources. I didn't compute any stock statistics myself. Equal-weight gaps use index figures where published, and the equal-weight ETF where not, so the 2025 gap is a range.
- Crypto closes. CoinGecko stamps each day at 00:00 UTC with the previous day's close, so I shift by one day to get the close on each date. November 19 uses CoinGecko's price at 16:00 UTC, the latest available.
- NVIDIA's November 12 close is calculated from the published 4.34% fall; the other closes are published.
FAQ
What is market breadth?
How many stocks or coins take part in a move. A broad market rises on most of its members. A narrow one rises on a few large ones while the rest lag. Common measures are the equal-weight index against the normal one, the share of stocks beating the index, and, in crypto, the share of altcoins beating Bitcoin.
Why did altcoins do so badly in 2025?
Because the money stayed at the top. The S&P 500 rose 16% on a handful of megacaps, and inside crypto Bitcoin dominance reached 64%. The median top-30 altcoin fell 51% while Bitcoin fell 6%, and only 6 of 30 beat Bitcoin.
How concentrated is the stock market?
The 10 largest companies were about 40% of the S&P 500 at the end of 2024, against about 27% at the 2000 dot-com peak. Across the whole US market, the top 10 passed the old 1932 record in October 2025.
Does stock market breadth predict altcoin season?
Not reliably on its own. Every crypto bull market came with a strong stock market, and the 2021 alt season followed small caps' best quarter on record. But in 2017 alts boomed while stock breadth was only average. The clearest match is 2023-25, when both markets were narrow at the same time.
What is Bitcoin dominance, and why does it matter for altcoins?
Bitcoin dominance is Bitcoin's share of the total crypto market cap. It fell hard in every past alt season: to 35% in January 2018 and 39% in May 2021. In the 2023-25 bull market it rose instead, from 39% to 64% in June 2025, and only 6 of the top 30 alts beat Bitcoin over the run.
Why did NVIDIA stock fall in late 2026?
It fell 39% from its October 6 record to November 19. The CEO resigned on November 12, but 70% of the drop came before that, including a 12% fall in chip stocks on November 5. Revenue still grew 103%. The fall looks more like a crowded trade unwinding than a business problem.
Where Cyclesolved fits
Every coin page shows its Quality score (how established and how widely traded the coin is), its risk grade, and every metric we read across technicals, on-chain, fundamentals, sentiment and macro, with the reading behind each one.
Start here:
No ads. No calls. No hype. No paid coin promotions, ever.
Data provided by CoinGecko
Not financial advice. Educational only.
Get the daily brief
The market backdrop, how broad the alt market is, and the day's biggest movers with their Quality score and risk grade. One email each morning.
Double opt-in. Unsubscribe in one tap.
See this on real coins
Every coin in the top 300, ranked by its Quality score, with its risk grade and every metric's reading.