
XRP price analysis: Fibonacci levels, market cap, and the Bitcoin signal
On this page
Summary
As of November 19, 2026, XRP trades at $0.97, a market cap of $61.5B on CoinGecko's circulating supply of 63.5B XRP. Sites that count supply differently show a different market cap for the same price. It is 73% below its July 2025 high of $3.55, and on November 15 it closed at $0.91, its lowest close since November 2024.
Three things in the data shape how I read XRP's price from here:
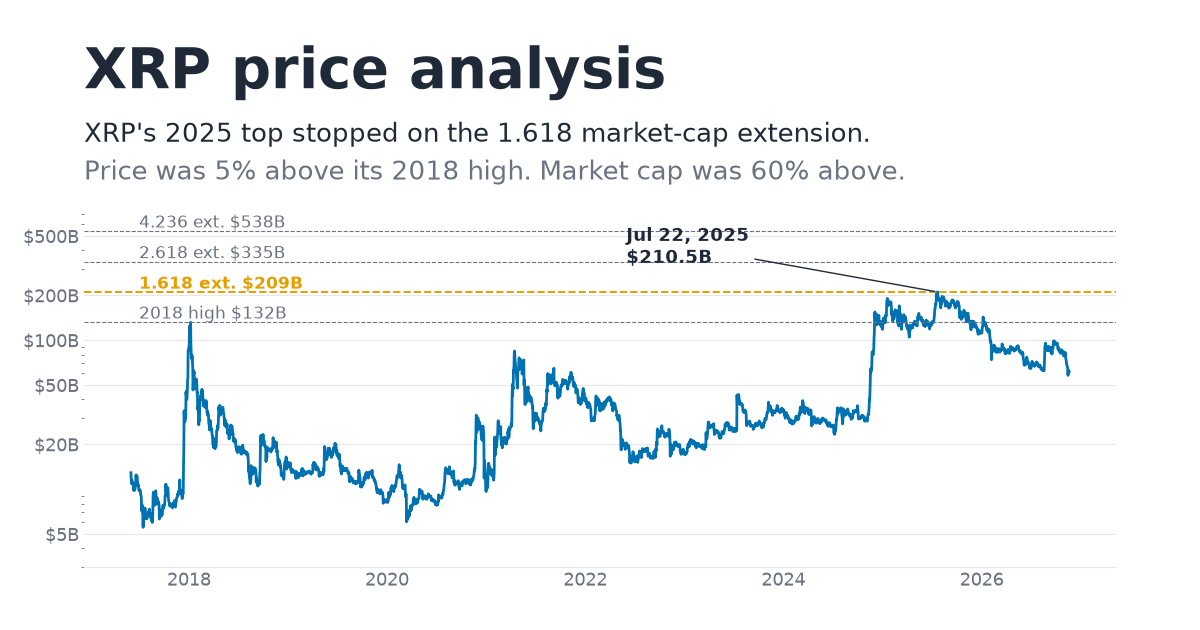
- Tops are set by market cap, not price. XRP's circulating supply has grown 64% since 2018 (38.7B to 63.5B). The same price now means a much bigger market cap. In 2025 XRP's price went only 4.6% past its 2018 high. Its market cap went 60% past it and landed on the 1.618 Fibonacci extension of its 2018-2020 swing: $210.5B against a level of $209B. Few cycle tops land that precisely; below I count how few.
- The levels that matter now. Fibonacci levels from two swings (2018 high to 2020 low, and the 2025 high to this month's low) put the first levels above at $1.38 to $1.54, and the old highs at $3.40 to $3.55. The full tables, with what each price means in market cap, are below.
- Alts have waited for Bitcoin. In each of the last three cycles, the median altcoin lost 55-60% against BTC between Bitcoin's bear-market low and the day Bitcoin closed back above its old high. The big alt runs came after that day. Bitcoin is at $63K today; its old high is $124,740.
This is history and arithmetic, not a forecast. Fibonacci levels are where tops have sometimes stalled. I show how often below.
Why market cap, not price
A coin's price can only be compared across cycles if its supply stayed the same. XRP's didn't. Escrow releases have added about 25 billion XRP to the circulating supply since January 2018, so every dollar of price now carries 64% more market cap than it did then.
| Price | Circulating supply | Market cap | |
|---|---|---|---|
| January 7, 2018 high | $3.40 | 38.7B | $131.7B |
| July 22, 2025 high | $3.55 | 59.2B | $210.5B |
| November 19, 2026 | $0.97 | 63.5B | $61.5B |
The idea I wanted to test: in 2021, did the large coins top out when their market cap reached the 4.236 Fibonacci extension of their 2018 swing, even where price hadn't?
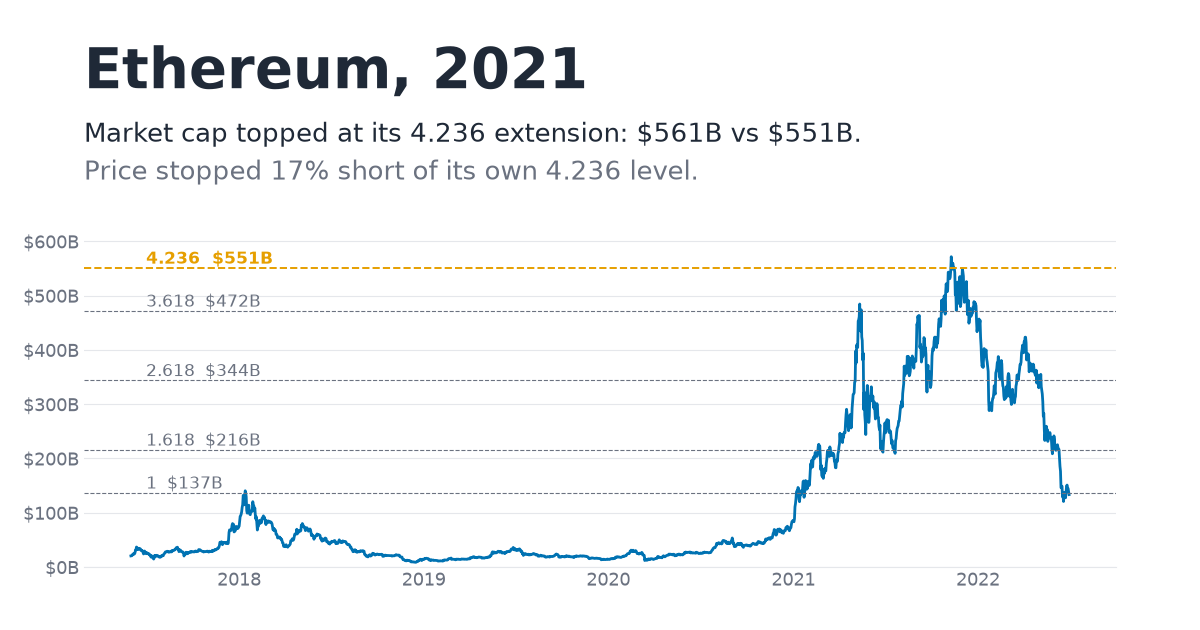
For Ethereum, almost exactly. Draw the swing from ETH's January 2018 market-cap high ($136.7B) to its bear-market low ($8.7B). The 4.236 extension is $551B. ETH's market cap peaked on November 9, 2021 at $561B, within 2% of the level, and lost more than 75% over the next year. On price alone, ETH stopped 17% short of its own 4.236 level. A chart drawn on price would have pointed higher than the top.
It did not work as a rule, though. Across the 18 large coins of 2018 that I could measure:
| Where each coin's market cap topped in 2021 | Coins |
|---|---|
| At or just under the 4.236 extension | Ethereum (2% above the level), Ethereum Classic (6% below) |
| Topped between the 2.618 and 4.236 extensions | Cardano (0.81x of 4.236) |
| Ran far past 4.236 (small in 2018) | Theta, Dogecoin, Chainlink, BNB |
| Passed the 2018 market cap but stopped below 1.618 | Litecoin, Monero, Stellar, Zcash |
| Below its 2018 market cap, in 2021 | XRP, Bitcoin Cash, EOS, TRON, NEO, IOTA, Dash |
And checking every coin I pulled against any Fibonacci level, not just 4.236: 3 of these 18 cycle tops in 2021 landed within 5% of one (Ethereum, Litecoin, Zcash), and 3 of 24 coins in 2024-25. That happens, and when it does it can be precise. But most tops did not land on a level, so treat these as places to pay attention, not targets.
Get the daily brief
One email each morning: the day's biggest price movers and a short read on the market.
Double opt-in. Unsubscribe in one tap.
XRP's market-cap levels
XRP is one of the precise ones. Its 2021 peak ($82B, April 14, 2021) stayed below its 2018 market cap; the SEC sued Ripple in December 2020, and XRP lagged the whole cycle. In 2025 it went past the 2018 high and stopped on the 1.618 extension of that 2018-2020 swing.
One caution: the swing you measure from matters. Measured from the 2021 swing instead, the 2025 peak lands at 2.90, nowhere near a level.
Here are the extensions of the 2018 swing (market-cap high $131.7B, low $6.03B), with the price each one means at today's supply:
| Extension | Market cap | XRP price at 63.5B supply |
|---|---|---|
| 1 (2018 high) | $132B | $2.07 |
| 1.618 (2025 top) | $209B | $3.30 |
| 2.618 | $335B | $5.28 |
| 3.618 | $461B | $7.26 |
| 4.236 | $538B | $8.48 |
Supply keeps growing, so each of these prices drifts lower over time. A market-cap level is the steadier line; the price it implies falls as more XRP circulates.
XRP's price levels: two swings
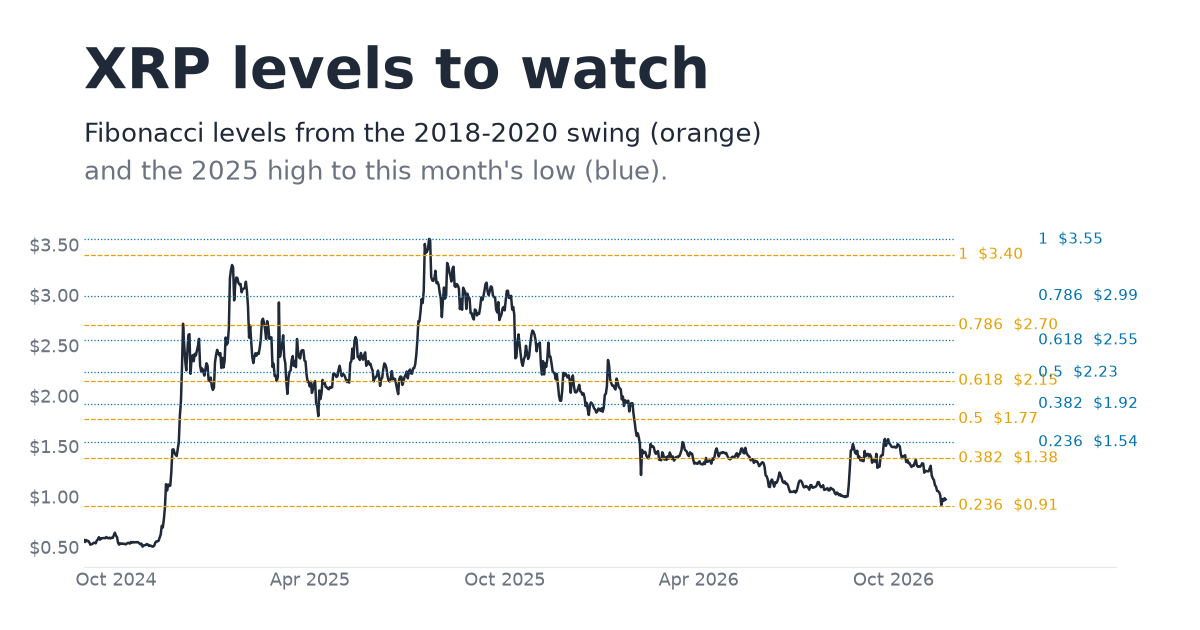
Swing 1: January 2018 high ($3.40) to March 2020 low ($0.139). This month's low, $0.91 on November 15, sits on this swing's 0.236 level ($0.91). It is the first level the 2025-26 decline has bounced from. Four days is a bounce, not yet a hold.
Swing 2: July 2025 high ($3.55) to the November 15, 2026 low ($0.91). These are the recovery levels for the current decline.
| Level | Swing 1 price | Market cap | Swing 2 price | Market cap |
|---|---|---|---|---|
| 0.236 | $0.91 | $58B | $1.54 | $98B |
| 0.382 | $1.38 | $88B | $1.92 | $122B |
| 0.5 | $1.77 | $112B | $2.23 | $142B |
| 0.618 | $2.15 | $137B | $2.55 | $162B |
| 0.786 | $2.70 | $171B | $2.99 | $190B |
| 1 | $3.40 | $216B | $3.55 | $226B |
| 1.618 | $5.41 | $344B | $5.19 | $329B |
| 2.618 | $8.67 | $550B | $7.83 | $497B |
| 4.236 | $13.95 | $885B | $12.10 | $768B |
Market cap here is price times today's supply (63.46B). Levels use the unrounded closes: $3.3985 and $0.1387 for swing 1, $3.5546 and $0.9137 for swing 2. Redoing them from rounded figures can move a cell by a cent or $1B. That is why swing 2's level 1 reads $226B: it is the 2025 high's close ($3.5546) at today's supply. The 2025 top itself was $210.5B, on 59.2B XRP.
Read the two tables together. On price, swing 1's 1.618 is $5.41. In market cap that is $344B, above the market-cap 2.618 level ($335B, or $5.28). The price extensions run ahead of the market-cap extensions because they ignore the extra supply. That is the same gap that made ETH's price chart point past its 2021 top.
The swing 2 retracements are the more practical set: $1.54, $1.92, $2.23, then $2.55. A move back through the 2025 high ($3.55, or $226B) would put XRP above both the 1.618 market-cap level and its 2025 top.
Alts have waited for Bitcoin's new high
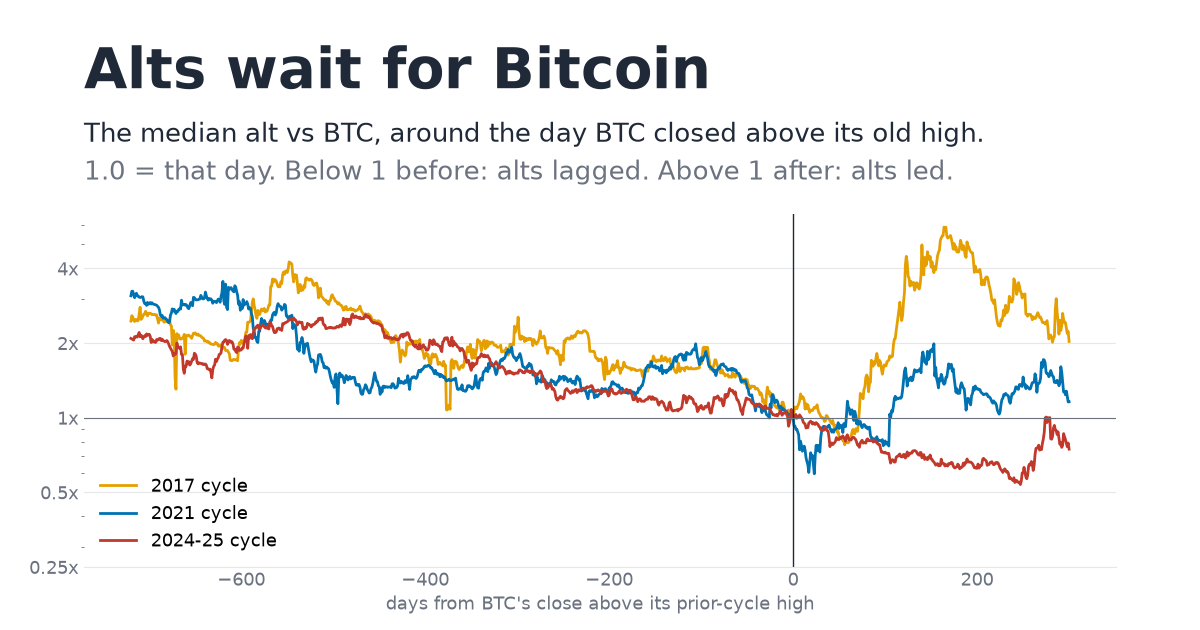
The general thesis: altcoins climb with Bitcoin in the early bull, but they don't outperform until Bitcoin has made a new all-time high. I measured it on 23 large coins across three cycles, using the day Bitcoin first closed above its prior-cycle high.
| Cycle | BTC reclaims old high | Median alt vs BTC, low to reclaim | Median alt vs BTC after, at its best | XRP vs BTC, reclaim to BTC's top |
|---|---|---|---|---|
| 2017 | Jan 4, 2017 ($1,127) | x0.45 | x5.88 (Jun 2017) | x6.68 |
| 2021 | Dec 17, 2020 ($19,665) | x0.43 | x1.99 (May 2021) | x0.71 |
| 2024-25 | Mar 5, 2024 ($67,539) | x0.40 | x1.03 (3 days later) | x2.52 |
Three things stand out:
- Before the reclaim, every cycle looks the same. From Bitcoin's low to its new high, the median alt lost 55-60% against BTC. Alts went up in dollars, but less than Bitcoin.
- The cycle tops came after the reclaim. Almost every alt I measured made its cycle high after Bitcoin's reclaim day: 6 of 6 in 2017, 18 of 18 in 2021, 21 of 23 in 2024-25 (Cosmos and Polygon peaked before it).
- The run after the reclaim is not guaranteed. 2017 and 2021 had broad alt seasons. In 2024-25 there wasn't one. The median alt peaked against BTC three days after the reclaim and lagged for the rest of the cycle; only 6 of 23 beat BTC.
XRP was one of those six. From the 2024 reclaim to Bitcoin's October 2025 top, XRP gained 2.5x against BTC while the median alt lost more than a third. In 2021 it was the reverse: XRP lagged while most alts ran.
Bitcoin's prior high is now $124,740 (October 7, 2025), and it trades at $63K. Our Altcoin Season Index tracks how many of the top 50 alts beat Bitcoin over the last 90 days, live. The standard rule needs 75 for an alt season, and its highest reading in the past year was 68. On this history, the stretch where alts lag Bitcoin comes before that line is crossed, and the big alt moves come after it.
What XRP has going for it
XRP has outliers on its side that most alts don't:
- One of the largest communities in crypto, which stayed with it through a bear market and the SEC lawsuit that ran from December 2020 into 2025.
- Spot XRP ETFs in the US, launched in November 2025. They took in about $1.79B of net inflows by November 13, 2026 and hold more than 1 billion XRP (TokenPost, inflows and holdings). Flows have turned negative with the price: about $19M left in the week of November 9-13.
- Ripple building on the XRP Ledger. In October, BNY said it is adding XRP and Ripple's RLUSD stablecoin to its custody platform (The Block). Robinhood said it plans to settle in RLUSD on the XRP Ledger (same report); C2FO is moving invoice settlement onto the ledger (Ripple). Most of that runs in RLUSD, though, with XRP paying the fees and reserves. As I measured in Does anyone have to buy your token?, required use is not the same as large demand: XRP's fee burn was 0.0003% of its market cap over a year.
- It already broke the pattern once. In 2024-25, when the median alt never had its season, XRP outran Bitcoin by 2.5x after the reclaim.
None of that changes the arithmetic above. It is why XRP is one of the coins where the outlier case is worth taking seriously.
How to use this
- Watch Bitcoin's old high first. A close above $124,740 is the line most of the alt moves I measured came after. August 2020 is the exception: that alt season began with Bitcoin 40.2% below a high set 965 days earlier (details).
- Read levels in market cap. For XRP, $132B (2018 high), $209B (the 2025 top's 1.618) and $335B (2.618) are the market-cap levels; divide by the current supply for the price.
- Watch the near levels. XRP has bounced from $0.91 so far. Above it, $1.38-$1.54 is where the first levels from both swings sit.
- Expect most tops to miss the lines. 3 of 18 in 2021, 3 of 24 in 2024-25. A level is a place to pay attention, not a sell order.
XRP's coin page has its live price chart, risk grade and Quality score, and the Altcoin Season Index tracks how many of the top 50 alts are beating Bitcoin each day.
How I measured
- Data. Daily closes and market caps from CoinGecko, all history, pulled November 19, 2026. Daily closes differ from intraday wicks: XRP's January 2018 wick high was well above its $3.40 close, so wick-based charts give higher levels.
- Fibonacci levels. Fibonacci levels are linear: level = low + k x (high - low). Extensions are k above 1; retracements are k below 1.
- Highs and lows. Market-cap highs and lows use a 3-day median to drop single-day data glitches.
- Hit rate. "Within 5% of a level" uses the same 18 coins as the 2021 table (and 24 coins for 2024-25, measured from each coin's 2021 swing). It checks each coin's cycle-top market cap against the 1, 1.272, 1.618, 2.618, 3.618 and 4.236 levels of its previous swing.
- Alts vs BTC. The BTC comparison uses up to 23 coins that were large in each cycle and had data on both dates. VeChain is left out of the 2018 table because its 2018 token was swapped for a new one.
FAQ
What is XRP's market cap today?
About $61.5B on November 19, 2026: a close of $0.9698 times a circulating supply of 63.46B XRP (CoinGecko). Its highest market cap was $210.5B on July 22, 2025.
What are the Fibonacci levels for XRP?
The first levels above $0.97 are $1.38 (the 0.382 retracement of the 2018 high to 2020 low) and $1.54 (the 0.236 retracement of the 2025 high to this month's low). The old highs, $3.40 and $3.55, are level 1 of each swing. The 1.618 extensions sit at $5.19 and $5.41.
Will XRP go back to $3.55?
I don't forecast it. At today's supply, $3.55 is a $226B market cap, above the $210.5B top of 2025. On past cycles, the big alt moves came after Bitcoin closed above its old high, which is $124,740 now.
Why did XRP's price barely pass its 2018 high in 2025?
Supply. Circulating XRP grew 64% between the two tops, from 38.7B to 63.5B. XRP's price went 4.6% past its 2018 high, but its market cap went 60% past it.
Do Fibonacci levels work for crypto tops?
Sometimes, not reliably. Only 3 of 18 large coins topped within 5% of a Fibonacci level of their previous swing in 2021, and 3 of 24 in 2024-25. Ethereum's 2021 top landed on its 4.236 market-cap extension; most tops did not land on any level.
Where Cyclesolved fits
Every coin page shows its Quality score (how established and how widely traded the coin is), its risk grade, and every metric we read across technicals, on-chain, fundamentals, sentiment and macro, with the reading behind each one.
Start here:
No ads. No calls. No hype. No paid coin promotions, ever.
Data provided by CoinGecko
Not financial advice. Educational only.
Get the daily brief
XRP's Quality score and risk grade, BTC dominance and the day's biggest movers. One email each morning.
Double opt-in. Unsubscribe in one tap.
See this on real coins
Every coin in the top 300, ranked by its Quality score, with its risk grade and every metric's reading.