
Does the 200-day moving average work? 13 years of Bitcoin, tested
On this page
Summary
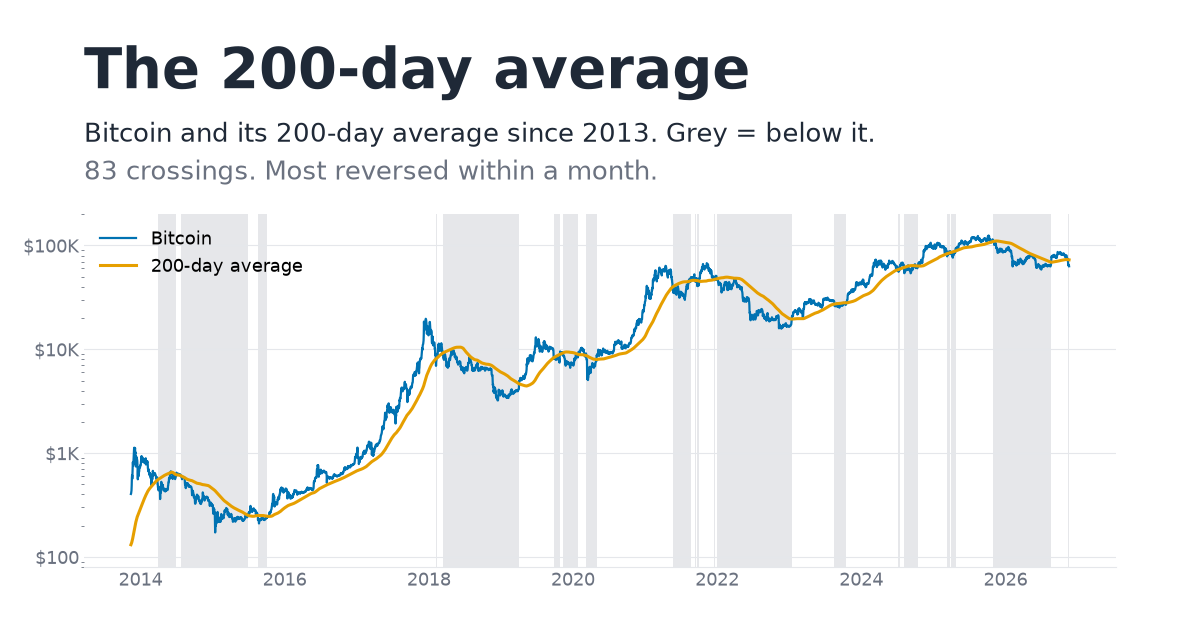
As of November 19, 2026, Bitcoin traded at $63,031, 13.3% below its 200-day moving average of $72,728. It crossed below on November 13.
The 200-day average is the most quoted line in crypto. I tested the simplest rule built on it on every Bitcoin close since 2013: hold when the close is above the 200-day average, hold cash when it is below. Three findings:
- It cut the worst drop in every cycle. From each cycle low to the next, the rule's worst fall was smaller than holding's: -67% vs -84%, -64% vs -77%, and -32% vs -53%. That held in every span I measured.
- Whether it beat holding depends on the date you start. Start at a cycle top and the rule wins three of four spans. Start at a cycle low and holding wins two of three cycles, and wins overall: x366 for holding vs x244 for the rule from the January 2015 low to today.
- Most crossings were noise. There were 83 crossings. 63% reversed within 14 days. The rule made money on 14 of 41 round trips; the five best made the whole gain.
So the 200-day average works as a drawdown control, not as a way to beat holding. It is late at both ends: it exits after a big chunk of the fall and gets back in after a big chunk of the bounce.
What I tested
The rule is deliberately plain, because the plain version is what people quote:
- Signal. Bitcoin's daily close against the simple average of the last 200 daily closes.
- Trade. The signal is read on one day's close and the position changes at the next day's close. No buying on the same close that gave the signal.
- Cost. 0.1% per buy and per sell.
- Benchmark. Holding Bitcoin over the same dates.
I report each cycle separately, measured two ways: top to top and low to low. A single whole-history number hides how much the answer moves with the start date, which is the main finding.
The results, cycle by cycle
Low to low (each span starts at a Bitcoin bear-market low):
| Span | 200-day rule | Hold | Rule's worst drop | Hold's worst drop | Time in the market |
|---|---|---|---|---|---|
| Jan 2015 low to Dec 2018 low | x23.5 | x18.7 | -67% | -84% | 65% |
| Dec 2018 low to Nov 2022 low | x3.5 | x4.9 | -64% | -77% | 51% |
| Nov 2022 low to today | x3.0 | x4.0 | -32% | -53% | 64% |
| Jan 2015 low to today | x244 | x366 | -67% | -84% | 60% |
Top to top (each span starts at a cycle high):
| Span | 200-day rule | Hold | Rule's worst drop | Hold's worst drop |
|---|---|---|---|---|
| Nov 30, 2013 top to Dec 16, 2017 top | x26.0 | x17.4 | -67% | -85% |
| Dec 16, 2017 top to Nov 9, 2021 top | x1.9 | x3.4 | -67% | -84% |
| Nov 9, 2021 top to Oct 7, 2025 top | x2.3 | x1.8 | -36% | -77% |
| Oct 7, 2025 top to today | x0.82 | x0.51 | -20% | -53% |
Start at a top, and the rule wins three of four spans, because it steps aside for most of the bear market that follows. The exception is 2017-2021: it only got out after a 65% fall, then paid for a late re-entry and a run of short, losing trades. Start at a low, and it looks expensive, because it sits out the first part of every recovery. Over the full history the rule finishes ahead, x258 against x156 for holding. That run starts on November 13, 2013, the first day with a 200-day average, at $404. Seventeen days later Bitcoin topped at $1,127, and the rule's exit from the 2014 bear market counts in its favor from there on.
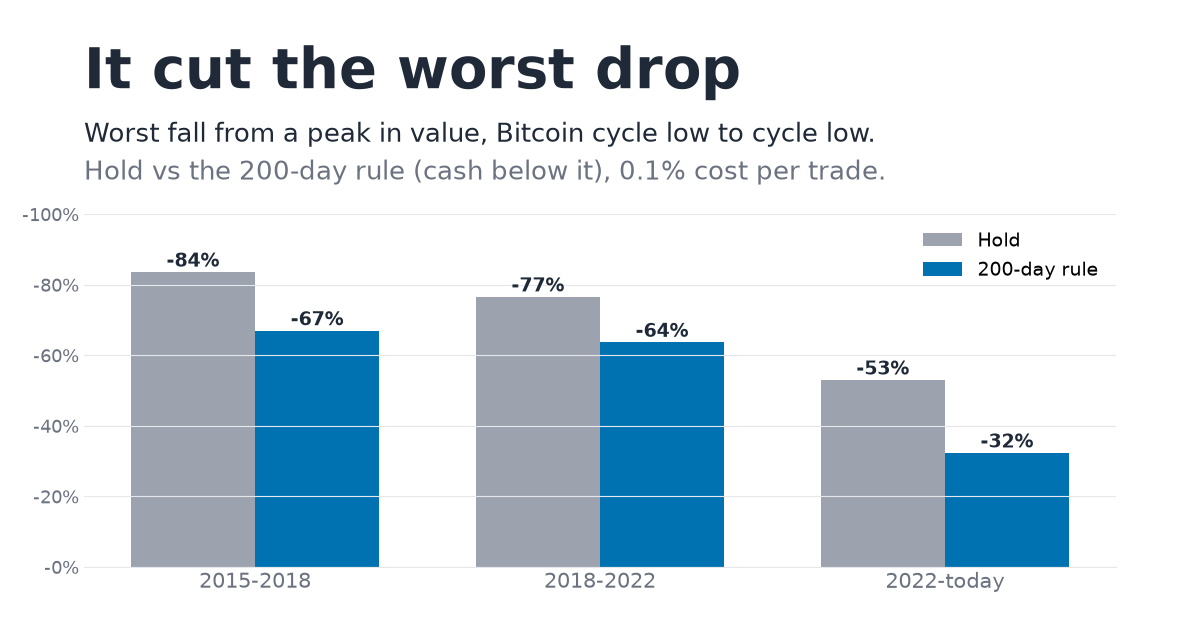
The drawdown column is the steady part. In every span, top to top or low to low, the rule's worst fall was smaller than holding's. It was still large: a -67% drop is not protection most people would recognize as protection.
Get the daily brief
One email each morning: the day's biggest price movers and a short read on the market.
Double opt-in. Unsubscribe in one tap.
Most crossings were noise
Bitcoin crossed its 200-day average 83 times between November 2013 and November 2026. Most crossings didn't last:
| Crossing reversed within | Share of crossings |
|---|---|
| 7 days | 55% |
| 14 days | 63% |
| 30 days | 74% |
That produces a lopsided set of trades. Of the rule's 41 completed round trips (buy on a cross above, sell on the next cross below), 14 made money and 27 lost. The median round trip lasted 6 days and lost 1.5%. The losers were small: a median of -5.2%, and -16% at worst.
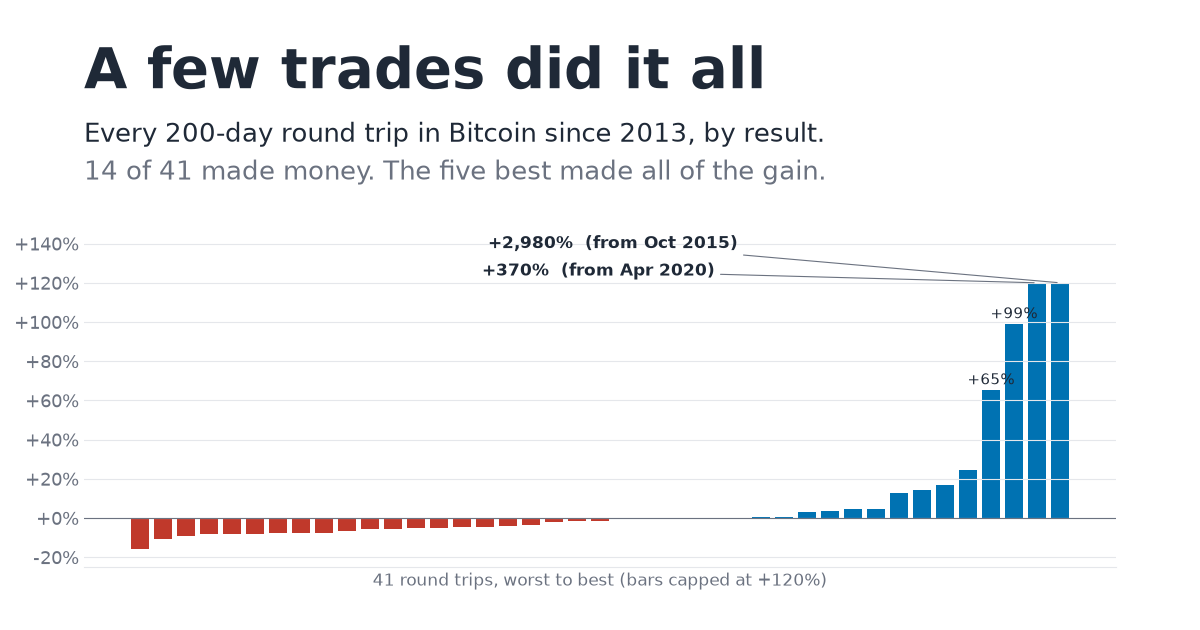
The gains came from a few long trends. The October 2015 entry rode the 2017 bull run for 849 days and returned +2,980%. The April 2020 entry returned +370%. Those two plus three more account for everything: the other 36 round trips together lost 57%.
That is how trend rules behave. A long string of small, irritating losses pays for being in the market when a big trend arrives. Anyone using the rule has to sit through the losses to collect the trend, and most people quit during the losses.
It is late at tops and late at bottoms
The rule only reacts after price moves through a slow average, so it gives up a lot at both turns:
| Cycle top | First close below the 200-day | Fall from the top by then |
|---|---|---|
| Nov 30, 2013 ($1,127) | Mar 28, 2014 | -55% |
| Dec 16, 2017 ($19,665) | Feb 6, 2018 | -65% |
| Nov 9, 2021 ($67,539) | Dec 14, 2021 | -31% |
| Oct 7, 2025 ($124,740) | Oct 18, 2025 | -15% |
| Cycle low | First close above the 200-day | Rise off the low by then |
|---|---|---|
| Jan 14, 2015 ($172) | Jun 29, 2015 | +49% |
| Dec 16, 2018 ($3,216) | Apr 3, 2019 | +52% |
| Nov 22, 2022 ($15,794) | Jan 14, 2023 | +26% |
The exits have got earlier each cycle, because each top has been less stretched above its average: 518% above it in 2013, 277% in 2017, 48% in 2021 and 18% in 2025. A top that sits close to its average is crossed sooner. That is a feature of the last two cycles' shape, not a rule I would bank on.
Day counts vs crossings
The common case for the 200-day average is a day count: days above it were followed by better returns than days below. That is true in this data:
| Next 90 days | Days above | Days below |
|---|---|---|
| Median Bitcoin return | +11.6% | -1.8% |
| Share positive | 63% | 48% |
But consecutive days above the line are not separate signals. A 300-day run above is one decision, not 300. Counted by crossing (one entry per cross, measured from the next close), the gap at 90 days mostly disappears: a +15.3% median after crosses above against +11.3% after crosses below, with 24 of 41 and 26 of 41 positive. At 180 days the gap reopens (+18.5% vs -4.8%), carried by the few long trends.
This is the same problem I found in the Fear and Greed Index: counting days makes one long trend look like hundreds of confirmations.
What about altcoins?
I ran the same rule on 24 large altcoins from the 2017 and 2021 cycles, including several that have since collapsed (EOS, IOTA, Polkadot, Tezos), from each coin's 200th day to today:
- On each coin's own 200-day average: the rule beat holding on 11 of 24.
- Using Bitcoin's 200-day average as the switch (hold the alt only while Bitcoin is above its average): it beat holding on 18 of 24.
- Drawdowns stayed brutal either way: a median worst drop of -90% on the coin's own average, -89% on Bitcoin's, and -96% holding.
The alt result is the more interesting one. An alt's own trend line was a coin flip; Bitcoin's trend line was a better switch for alts than their own. But the 200-day rule did not keep alt drawdowns anywhere near tolerable. For alts it is a timing filter, not a safety net.
The 200-week average, briefly
The other famous line is the 200-week average, often called Bitcoin's floor. CoinGecko's history only gives two cycle lows with a full 200 weeks of data. In December 2018 the low closed 0.5% above it, about as close to a floor as it gets. In November 2022 the low closed 34% below it. One hold, one break.
Today Bitcoin is 7.3% below its 200-week average of $68,027.
Where Bitcoin is now
- Price: $63,031 on November 19, 2026 (CoinGecko, 16:00 UTC).
- 200-day average: $72,728. Bitcoin is 13.3% below it and crossed under on November 13, at $71,372.
- The average itself is flat: +0.2% over the last 30 days.
- 200-week average: $68,027. Bitcoin is 7.3% below it.
On the history above, being below the 200-day average says Bitcoin is in a downtrend, not where the bottom is. Past lows came months before price got back above the line.
How to use this
- Use it for drawdown control, not for returns. In every cycle it cut the worst fall. It didn't reliably beat holding.
- Expect to be wrong most of the time. About two of every three trades lost money, and the median trade lasted 6 days.
- Don't read one cross as a signal. 63% reversed within two weeks.
- For alts, watch Bitcoin's line. Bitcoin's 200-day average was a better switch for alts than their own.
Bitcoin's coin page has its live price chart, risk grade and Quality score, and the Altcoin Season Index tracks how many of the top 50 alts are beating Bitcoin each day.
How I measured
- Data. Daily closes from CoinGecko, full history, pulled November 19, 2026. Bitcoin from April 28, 2013; the first 200-day average is November 13, 2013.
- Rule. Hold when the close is above the simple 200-day average; cash otherwise. Signal on day t's close, position change at day t+1's close. 0.1% cost on every buy and sell. With no cost the full-history rule ends at x280; at 0.5% per side, x184. Holding is x156 over the same dates.
- Cycle dates. Lows: January 14, 2015; December 16, 2018; November 22, 2022. Tops: November 30, 2013; December 16, 2017; November 9, 2021; October 7, 2025.
- Crossings. 83 changes of side on daily closes. A round trip is a cross above followed by the next cross below; the open trade is excluded.
- Altcoins. 24 coins that were large in the 2017 or 2021 cycle, alive or not. Three data repairs: VeChain is left out (CoinGecko's series runs through its 2018 token swap unadjusted, a false -99% day), two glitch days in Stellar's March 2015 data are dropped, and Zcash starts January 1, 2017, after its launch-week chaos.
- Worst drop. The largest fall in the strategy's own value from its previous peak, so the rule's figure includes losing trades after an exit, not just the fall before it.
- Rounding. Multiples are rounded to one decimal, so the cells won't multiply exactly to the totals. Every total comes from unrounded prices.
- No interest on cash. The rule earns nothing while out of the market. Counting stablecoin or treasury yield would help it a little.
FAQ
Does the 200-day moving average work for Bitcoin?
As a drawdown control, yes: in every cycle since 2015 its worst drop was smaller than holding's. As a way to beat holding, not reliably. From the January 2015 low to November 2026, holding returned x366 and the 200-day rule x244.
What is Bitcoin's 200-day moving average today?
$72,728 on November 19, 2026, with Bitcoin at $63,031, 13.3% below it. Bitcoin crossed below on November 13.
Is a cross above the 200-day moving average a buy signal?
Not on its own. Of 83 crossings since 2013, 63% reversed within 14 days, and only 14 of 41 round trips made money. The rule's gains came from five long trends.
Does the 200-day moving average work for altcoins?
Weakly. Using each coin's own average, the rule beat holding on 11 of 24 large altcoins. Using Bitcoin's 200-day average as the switch, it beat holding on 18 of 24. Drawdowns stayed near -90% either way.
Should I sell Bitcoin when it falls below the 200-day moving average?
On this history it depends on what you want. Selling below the line and buying back above it cut the worst drop in every cycle: -67% against -84% from the 2015 low. But it lost to holding from the 2015 low to today (x244 against x366), and two of every three trades lost money. Most crosses reversed within two weeks.
Is the 200-week moving average Bitcoin's floor?
Not reliably. The December 2018 low closed 0.5% above it. The November 2022 low closed 34% below it.
Where Cyclesolved fits
Every coin page shows its Quality score (how established and how widely traded the coin is), its risk grade, and every metric we read across technicals, on-chain, fundamentals, sentiment and macro, with the reading behind each one.
Start here:
No ads. No calls. No hype. No paid coin promotions, ever.
Data provided by CoinGecko
Not financial advice. Educational only.
Get the daily brief
The market backdrop, where Bitcoin sits against its trend, and the day's biggest movers with their Quality score and risk grade. One email each morning.
Double opt-in. Unsubscribe in one tap.
See this on real coins
Every coin in the top 300, ranked by its Quality score, with its risk grade and every metric's reading.