
Is it altcoin season? Why the gauges disagree in 2026
Updated 25 September 2026
Is it altcoin season today?
No. 20 of the top 50 alts have beaten Bitcoin over the last 90 days. Altseason needs 38 of them. We are at 40%, and that is not close. A stricter rule also requires alt market cap, excluding BTC and stablecoins, to rise at least 50% over the same window.
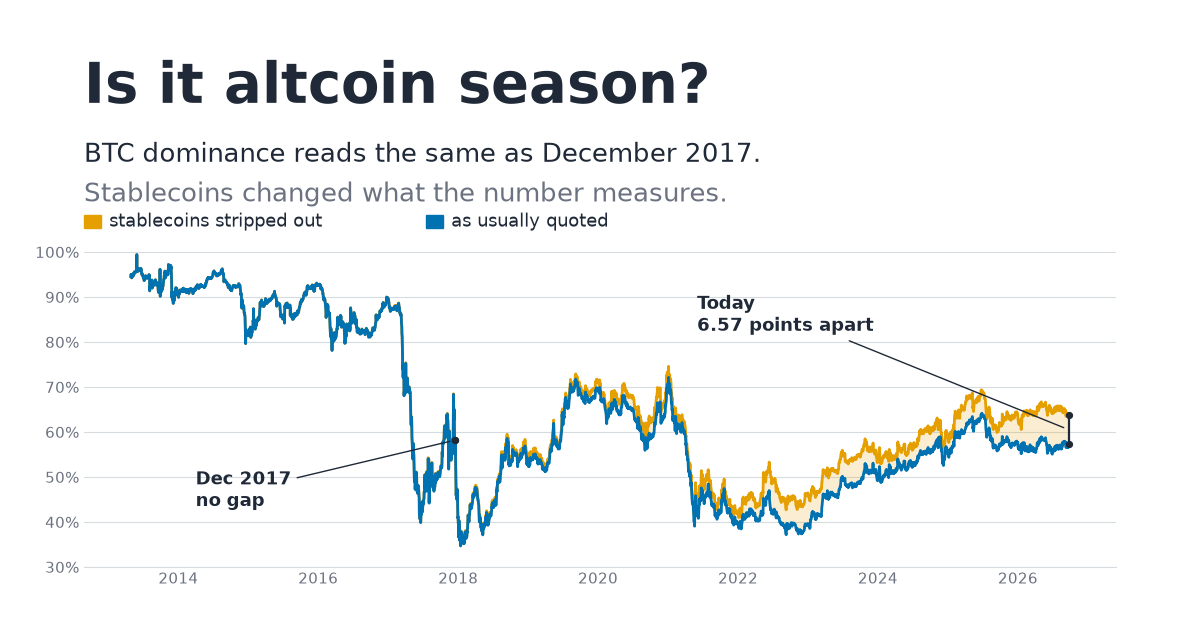
Yet other gauges can make this look like an early season. BTC dominance reads 57.23%, close to its 58.13% reading in December 2017. Raw dominance is down over 30 days. Crypto has pulled ahead of stocks over 90 days. Those facts are real. They do not measure broad altcoin participation.
The dominance denominator changed. Breadth catches a rotation once it starts. Macro expansion happens alongside crypto breakouts, not ahead of them.
What counts as an altcoin season?
I used two rules. The first matches the public Altcoin Season Index convention: at least 75% of the point-in-time top 50 altcoins must outperform BTC over a rolling 90 days. I call that breadth, or definition B.
The stricter rule, definition C, requires the same breadth and at least a 50% rise in alt market cap excluding BTC and stablecoins over the same 90 days. It asks whether alts rose substantially while beating BTC. Outperformance alone can mean they fell less.
That distinction matters. Breadth alone finds six episodes. It also includes a COVID-crash episode starting 2020-03-17 and a bear-market bounce starting 2022-08-10. At onset, BTC was 74.3% and 65.8% below its standing all-time high, respectively. Alts beat BTC, but alt market cap did not rise 50%. The stricter rule excludes both.
The stricter rule finds three episodes. Their date spans can include gaps merged into one event. They are not counts of qualifying days.
| Episode | Date span | Peak 90-day breadth |
|---|---|---|
| August 2020 | 2020-08-07 to 2020-08-19 | 87% |
| March 2021 | 2021-03-24 to 2021-06-05 | 100% |
| December 2024 | 2024-12-03 to 2024-12-09 | 84% |
Together they contain 81 qualifying days. I require at least five qualifying days for an episode and merge runs across gaps of 30 days or fewer. Three episodes are not a basis for an accuracy claim. August 2020 also needs its own inspection. It clears the rule, but it was a narrow DeFi-summer rally.
Counting episodes rather than days is the same discipline I used on sentiment in Does the Crypto Fear and Greed Index work?, where a single bull run supplied 58% of all extreme greed days and flipped the conclusion depending on which unit you counted.
BTC dominance today is not the 2017 number
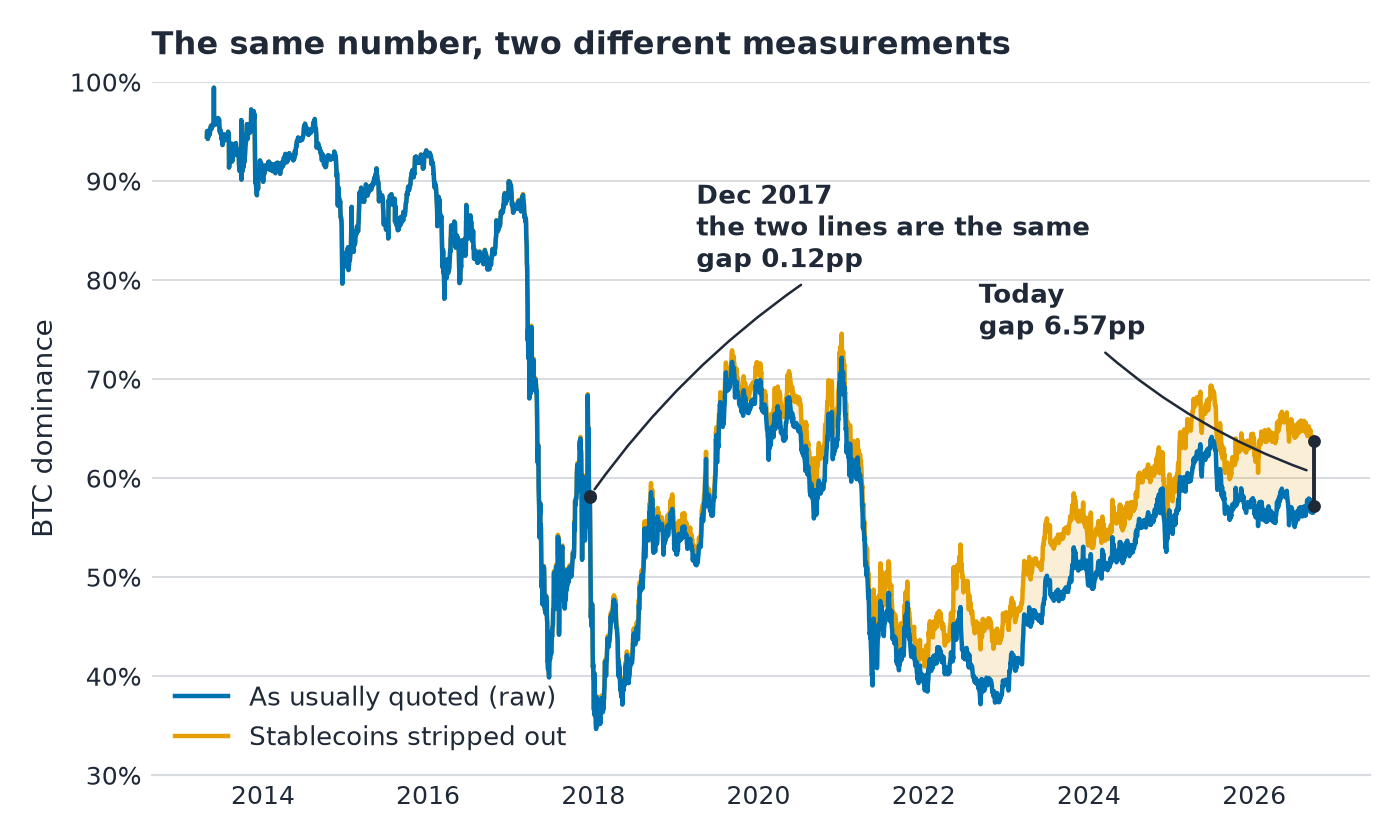
BTC dominance reads 57.23% today against 58.13% on 2017-12-16. Stablecoins make those raw readings incomparable.
| Date | Stablecoins as share of total | BTC dominance, raw | BTC dominance, stablecoins excluded |
|---|---|---|---|
| 2017-12-16 | 0.20% | 58.13% | 58.25% |
| 2026-09-24 | 10.30% | 57.23% | 63.80% |
Stablecoins barely moved the denominator in 2017. Today the top 40 stablecoins add $305.0B to a $2.962T total market. Strip them out and BTC dominance rises by 6.57 percentage points to 63.80%. On the same basis, today's dominance is about 5.5 points higher than at the top of the 2017 altseason.
Even this week's trend depends on which denominator you use. Over 90 days, raw dominance rose +1.61 points. Excluding stablecoins, it fell 0.96 points. Over 30 days, the moves were -0.32 and -0.82 points. A dominance chart without its denominator can tell two different stories about the same market.
CoinGecko's live global reading is 58.56%, not my 57.23%. My figure divides its BTC market-cap daily series by its total-market-cap daily series. The live global figure uses CoinGecko's full live universe. I kept the daily-series method consistent through the historical comparison. The stablecoin adjustment is larger than the gap between those two raw readings.
Get the daily brief
One email each morning: the scores that moved overnight, the coins that crossed a rating band, and the next big token unlock.
Double opt-in. Unsubscribe in one tap.
Breadth describes the move after it starts
The historical episodes do not give a clean advance warning. Here is what 90-day dominance change and 90-day breadth showed a month before each onset, then what breadth showed at onset.
| Onset | 90-day dominance change, 30 days earlier | 90-day breadth, 30 days earlier | 90-day breadth at onset |
|---|---|---|---|
| 2020-08-07 | -1.0pp | 47% | 78% |
| 2021-03-24 | -0.5pp | 62% | 79% |
| 2024-12-03 | +2.8pp | 28% | 76% |
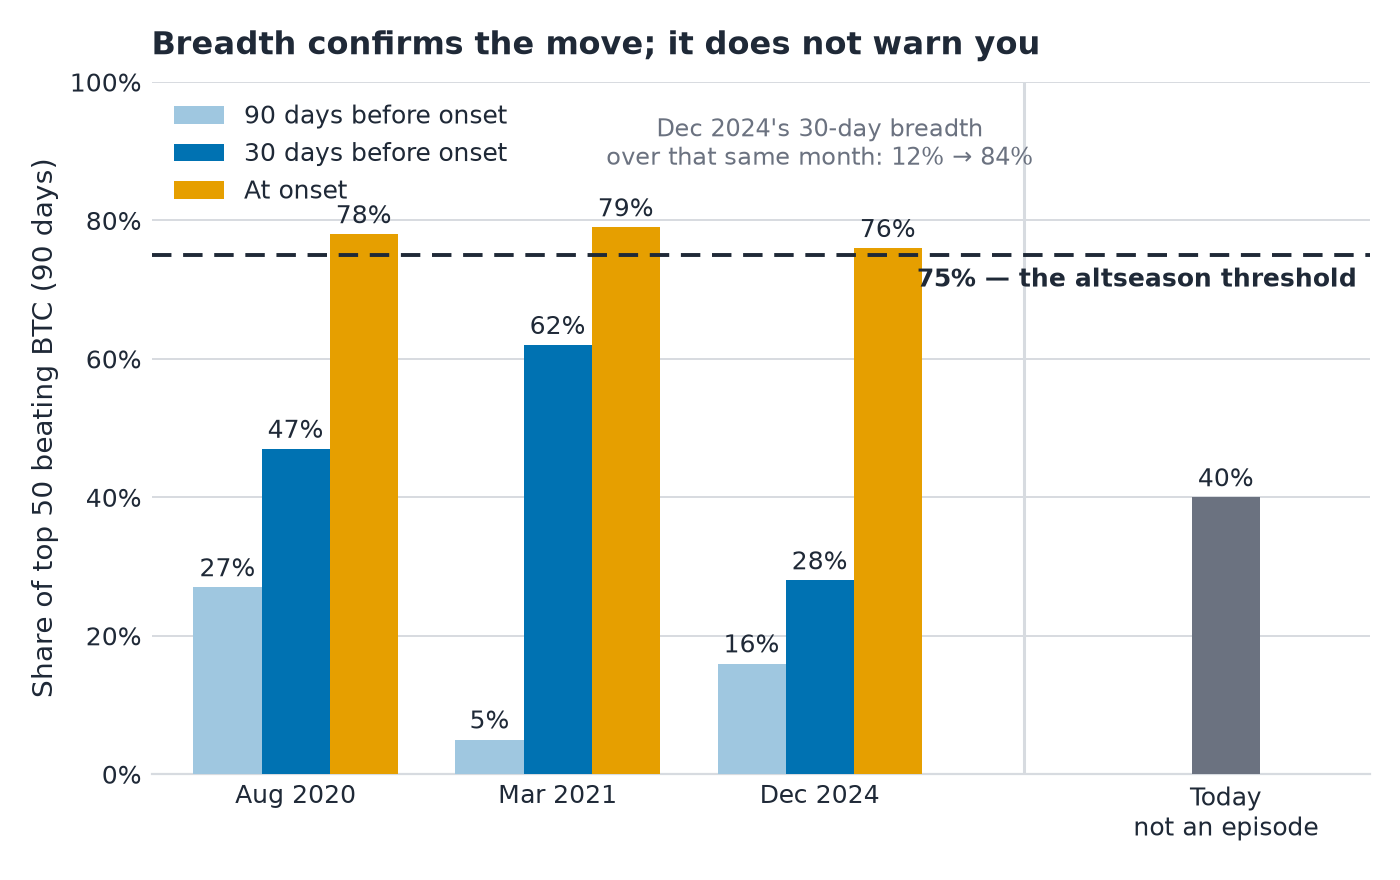
Dominance was still rising over its prior 90 days a month before December 2024. Then the move came quickly. Its 30-day breadth went from 12% a month before onset to 84% at onset.
Breadth confirmed the December move. It did not warn a month ahead. Today, 90-day breadth is 40.0%, with 20 of the top 50 beating BTC. Across all tracked alts with a full 90-day window, it is 47 of 101, or 46.5%. A 30-day top-50 reading of 52.0%, or 26 of 50, does not change the 90-day answer.
The idea that an altseason must follow a fresh BTC high also needs care. The March 2021 and December 2024 episodes began within ten days of a fresh BTC all-time high. August 2020 began with BTC 40.2% below a high set 965 days earlier. I can describe those three starts. I cannot turn them into a timing rule.
August 2020 passed the rule. It was not the same kind of move
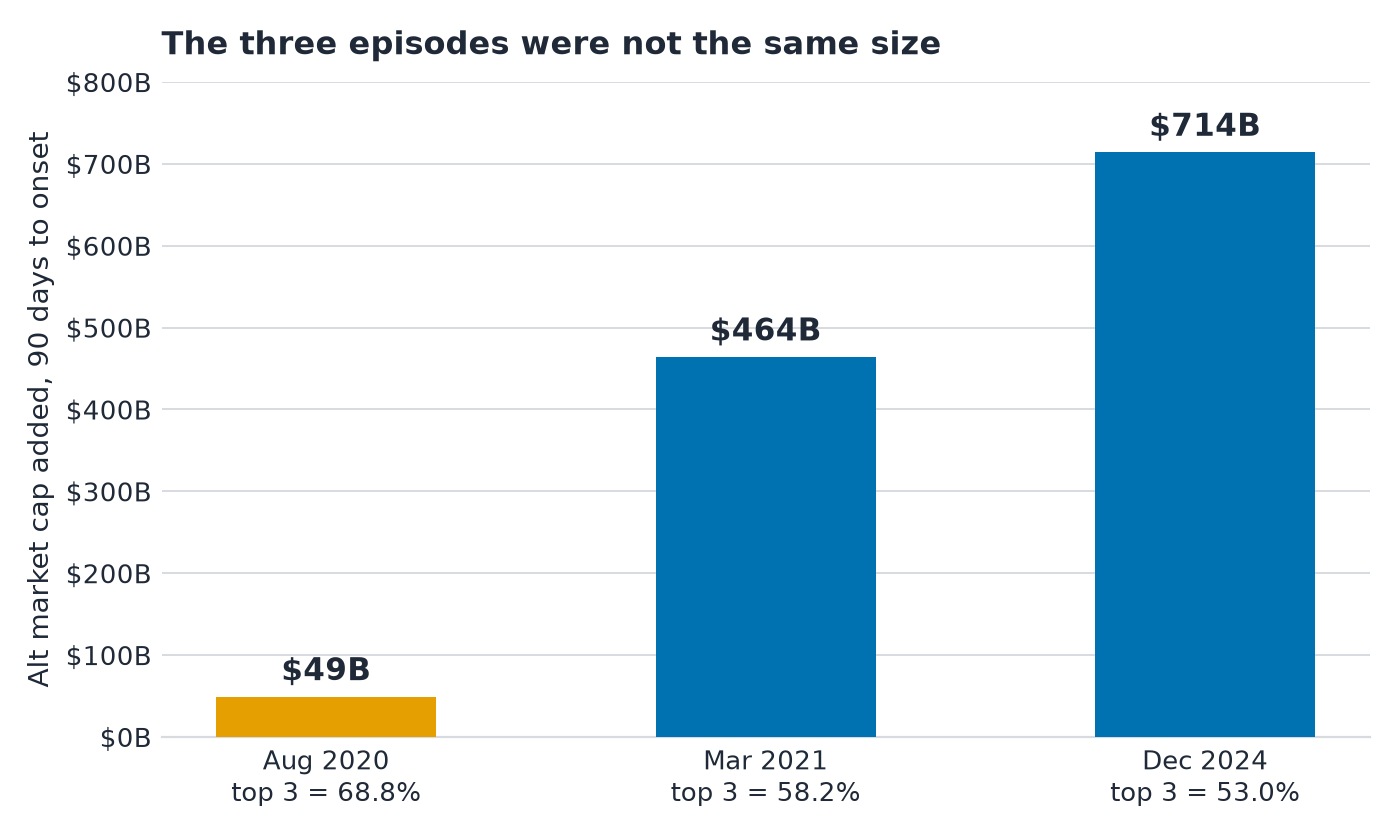
A percentage breadth threshold flattens differences in size and concentration. The 90-day windows ending at the three episode onsets show them again.
| Measure | August 2020 | March 2021 | December 2024 |
|---|---|---|---|
| Alt market cap ex-BTC ex-stables, 90-day change | +62.7% | +284.7% | +97.4% |
| Alt market cap added | +$49B | +$464B | +$714B |
| Coins with data at both ends | 31 | 41 | 74 |
| Top three share of the gain | 68.8% | 58.2% | 53.0% |
| Ethereum share of the gain | 51.9% | 38.1% | 24.5% |
| Top-50 breadth at onset | 25 of 32 = 78% | 33 of 42 = 79% | 38 of 50 = 76% |
| Median excess return vs BTC | +28.3pp | +190.2pp | +33.3pp |
August 2020 added $49B of alt market cap against $464B and $714B in the later episodes. Ethereum supplied 51.9% of that gain. The top three supplied 68.8%. Only 31 coins had prices at both ends of the window, and the top-50 breadth reading was really 25 of 32.
The arithmetic calls it an episode. I call it DeFi summer, a narrow rally. Showing the size and the concentration is more useful than insisting all three events meant the same thing.
What 103 tracked coins say now
Our scanner tracks 103 coins: BTC and 102 alts. Of those, 69 carry a full composite score; 34 do not, mostly because of insufficient data. The median score among the 69 is 58.
| Score band | Coins |
|---|---|
| 80-100 Strong Buy | 1 |
| 70-79 Buy | 11 |
| 60-69 Accumulate | 18 |
| 50-59 Neutral | 22 |
| 40-49 Caution | 14 |
| 0-39 Avoid | 3 |
Price has not shown broad recovery either. BTC is 32.4% below its all-time high. The median top-50 alt is 75.4% below its own. Across all 102 tracked alts, the median is 82.0% below its own high. BTC's high was $124,740 on 2025-10-07, 352 days before the reference date. This is a drawdown, not a fresh-high rotation. What a drawdown like this does and does not tell you is the subject of Bitcoin bear market bottoms: what the data supports.
The alt market is not getting less concentrated simply because there are more coins. The three largest alts hold 54.5% of alt market cap today, compared with 54.2% on 2017-12-16. The top ten hold 73.4% today against 75.3% then. Only 15 of the 102 alts we track today existed in December 2017. Capital spread across nearly seven times as many assets faces a different rotation problem. More names have not produced broader capital distribution at the top.
Macro expansion and crypto breakouts move together
I talk about Russell because it is the clearest place to see macro expansion. My position is that macro expansion and crypto breakouts happen at the same time. They are one trade. Russell is not an early-entry signal.
The return data fits the contemporaneous part of that view. IWM and crypto have a same-week correlation of +0.206 and a same-month correlation of +0.242. When IWM leads by a week, the correlation falls to +0.065. When it leads by a month, it is +0.016. The relationship is coincident, not leading. Anyone using Russell to get in early is using it wrong.
At each of the three measured altseason onsets, IWM/SPY had risen over the prior 90 days: +3.1% in August 2020, +3.1% in March 2021 and +2.8% in December 2024. Small caps were gaining against large caps as crypto breadth expanded. That is the claim, and each observed onset fits it.
Today the expansion is absent. IWM/SPY is down 9.8% over 90 days and sits at the 10th percentile of the last eight years. RSP/SPY is at the 0th percentile, the narrowest equal-weight versus cap-weight reading in the whole window.
This measure tells you what is happening now, not what happens next. Right now it points the same way as crypto breadth: narrow macro, narrow crypto.
My view, not a finding
I see crypto and macro as one trade. They diverge. The gaps tend to narrow through crypto moving, not through macro coming to meet it. That is my market read, separate from the altseason test above.
The horizon matters. Over 90 days, crypto total market cap is 27.7 percentage points ahead of SPY. Over one year, it is 40.8 points behind: crypto -25.1%, SPY +15.7%. When I say crypto is behind macro, I mean the one-year horizon, not the last quarter.
In the three completed historical episodes where the one-year gap reached at least today's severity, crypto rose +26.3%, +120.0% and +44.4% over the following 180 days. SPY rose +1.2%, +15.4% and +6.2%. One gap fully closed inside 180 days. Two narrowed without closing. These are persistent states with overlapping forward windows, not independent daily signals.
The current gap has already narrowed from -66.8 points on 2026-08-17 to -40.8 points on the reference day. Crypto rose +32.1% over that stretch while SPY fell 0.7%. I think crypto can keep catching up over the one-year comparison. That is my view, not a result of the altseason definition.
Catching up with macro is not the same as an altcoin season. Crypto can converge while the move stays concentrated in BTC. The breadth and market-cap tests still have to pass on their own.
How I tested it and what I cannot see
This is one run dated 2026-09-25. "Today" means 2026-09-24, the last complete daily bar. CoinGecko Pro supplied historical daily per-coin prices and market caps, along with total crypto market cap. The historical price window begins 2013-04-28; not every coin has prices back to that date. I used its top 40 stablecoins by market cap for the stablecoin adjustment. Our scanner supplied the 103 coin scores. Alpha Vantage IWM prices supplied the Russell test.
Historical breadth has a limit. The tracked universe is today's top coins, not a reconstructed top 50 from every past date. Only nine of today's 102 tracked alts existed on 2017-06-30. They represented 82.0% of non-BTC, non-stable alt market cap, so aggregate market cap can reach that far back. Breadth cannot. The 2017 altseason is invisible to my breadth-based episode definitions, which effectively begin in 2019. I used an aggregate-only bridge to inspect 2017, not to count a breadth episode. That aggregate rule fired on 21.7% of all days across 17 episodes. It is too broad to define an altseason.
Our own price history begins 2026-08-27 and score history begins 2026-04-28. Neither reaches a historical altseason. The historical test uses CoinGecko rather than pretending our short histories do.
Three strict-rule episodes, including August 2020, are all the data provide. I will not quote an accuracy rate from them. I can tell you what the measures said at each event and what they say now.
Related reads
The same habits apply to any indicator: define the unit before you count, and check the denominator.
- Does the Crypto Fear and Greed Index work? — counting episodes instead of days reverses the conclusion.
- Bitcoin bear market bottoms: what the data supports — what a drawdown this deep does and does not tell you.
- FDV vs Market Cap — the other place a denominator quietly changes the answer.
FAQ
Is it altcoin season in 2026?
Not on the 2026-09-24 reference day. Only 20 of the point-in-time top 50 alts, or 40.0%, beat BTC over 90 days. The breadth rule requires 75%, and the strict rule adds a 50% rise in alt market cap excluding BTC and stablecoins.
What is the altcoin season index today?
The comparable breadth measure in this run is 40.0% as of 2026-09-24: 20 of 50 top alts beat BTC over 90 days. That is our calculation using the index's 75% rule, not a claim about another site's live index reading.
Does falling Bitcoin dominance mean altcoin season?
No. Raw dominance fell 0.32 points over 30 days, but rose 1.61 points over 90 days. Stablecoins now take 10.30% of the total market-cap denominator, so I also check dominance without them and breadth against BTC.
Did altcoin seasons start after Bitcoin made a new high?
March 2021 and December 2024 began within ten days of a fresh BTC high. August 2020 began 40.2% below a high set 965 days earlier. Those episodes do not support a rule that every season starts after a new high.
Not financial advice. Educational only.
Get the daily brief
BTC dominance, the overnight score moves across the top 50, and the coins that crossed a rating band. These change every day, and the brief has them — one email each morning.
Double opt-in. Unsubscribe in one tap.
See this on real coins. Cyclesolved scores every coin in the top 100 across five categories and shows every input behind the number.