
Bitcoin bear market bottoms: what the data supports (and what it doesn’t)
Updated 15 September 2026

People ask the same questions every cycle.
Is the Bitcoin bottom in?
What marks a bear market bottom?
Which indicators actually work?
I ran the numbers on a few popular “bottom signals” and pulled published reporting on a few more.
Here is the honest answer.
Most indicators do not find bottoms. They confirm zones. They confirm regime shifts. They tell you when risk is changing. They rarely tell you “buy here.”
That is less exciting. It is also what the data supports.
TL;DR
- The cleanest repeating zone marker I can point to is Bitcoin supply held at an unrealized loss around ~10.5M coins. It has shown up near every major low, but it has arrived before a final leg lower in prior cycles.
- Weekly oversold plus a reclaim of the 50-week EMA has confirmed major lows in my backtest. It is confirmation, not discovery. It triggers months late and often 30% to 65% above the low.
- Fear & Greed is not contrarian in my backtest. It correlates positively with forward BTC returns at 7, 30, and 90 days. The popular “fear means buy” story does not hold in the general case.
- The live test in the current cycle is real. Supply-in-loss crossed the threshold in early June 2026. BTC then put in its lows between early June and the first days of July, bottoming around $58,000 to $58,600 depending on the source. BTC is just over $75k late on Sep 15.
Here is where BTC sits today.
What you are trying to measure when you say “bottom”
A bear market low is not one thing.
Sometimes it is a liquidation event. Sometimes it is slow exhaustion. Sometimes it is macro.
So the only honest way to talk about “bottom signals” is to say what each signal can do.
Does it flag stress?
Does it flag exhaustion?
Does it confirm recovery?
Does it only look good in hindsight?
I’ll keep that framing throughout.
Indicator 1: Bitcoin supply in loss (~10.5M) marks the zone
Claim: At every major bear market low, BTC supply held at an unrealized loss has crossed roughly 10.5 million coins.
This is the cleanest repeating zone marker in this piece.
Instances (historical)
Published reporting that cites Glassnode has documented the same zone around prior major lows (2018, 2020, 2022). One example is this CoinDesk piece from June 2026: https://www.coindesk.com/markets/2026/06/04/this-bitcoin-metric-has-marked-every-bear-market-bottom-and-it-s-just-flashed-again/
2026: what I see on the Glassnode chart
These readings are from Glassnode's BTC Percent Supply in Profit chart, daily resolution. Other providers run a few points lower on the same dates.
It shows a threshold crossing, then a second and deeper dip.
- Early June: supply in profit dipped to roughly 47% to 48%, meaning 52% to 53% in loss, with BTC around $61,000.
- Later in the low period: supply in profit dipped to roughly 45% to 46%, meaning 54% to 55% in loss, with BTC bottoming around $58,000 to $58,600 depending on the source.
At roughly 20 million BTC circulating, 54% to 55% in loss implies about 10.8 to 11.0 million coins in loss.
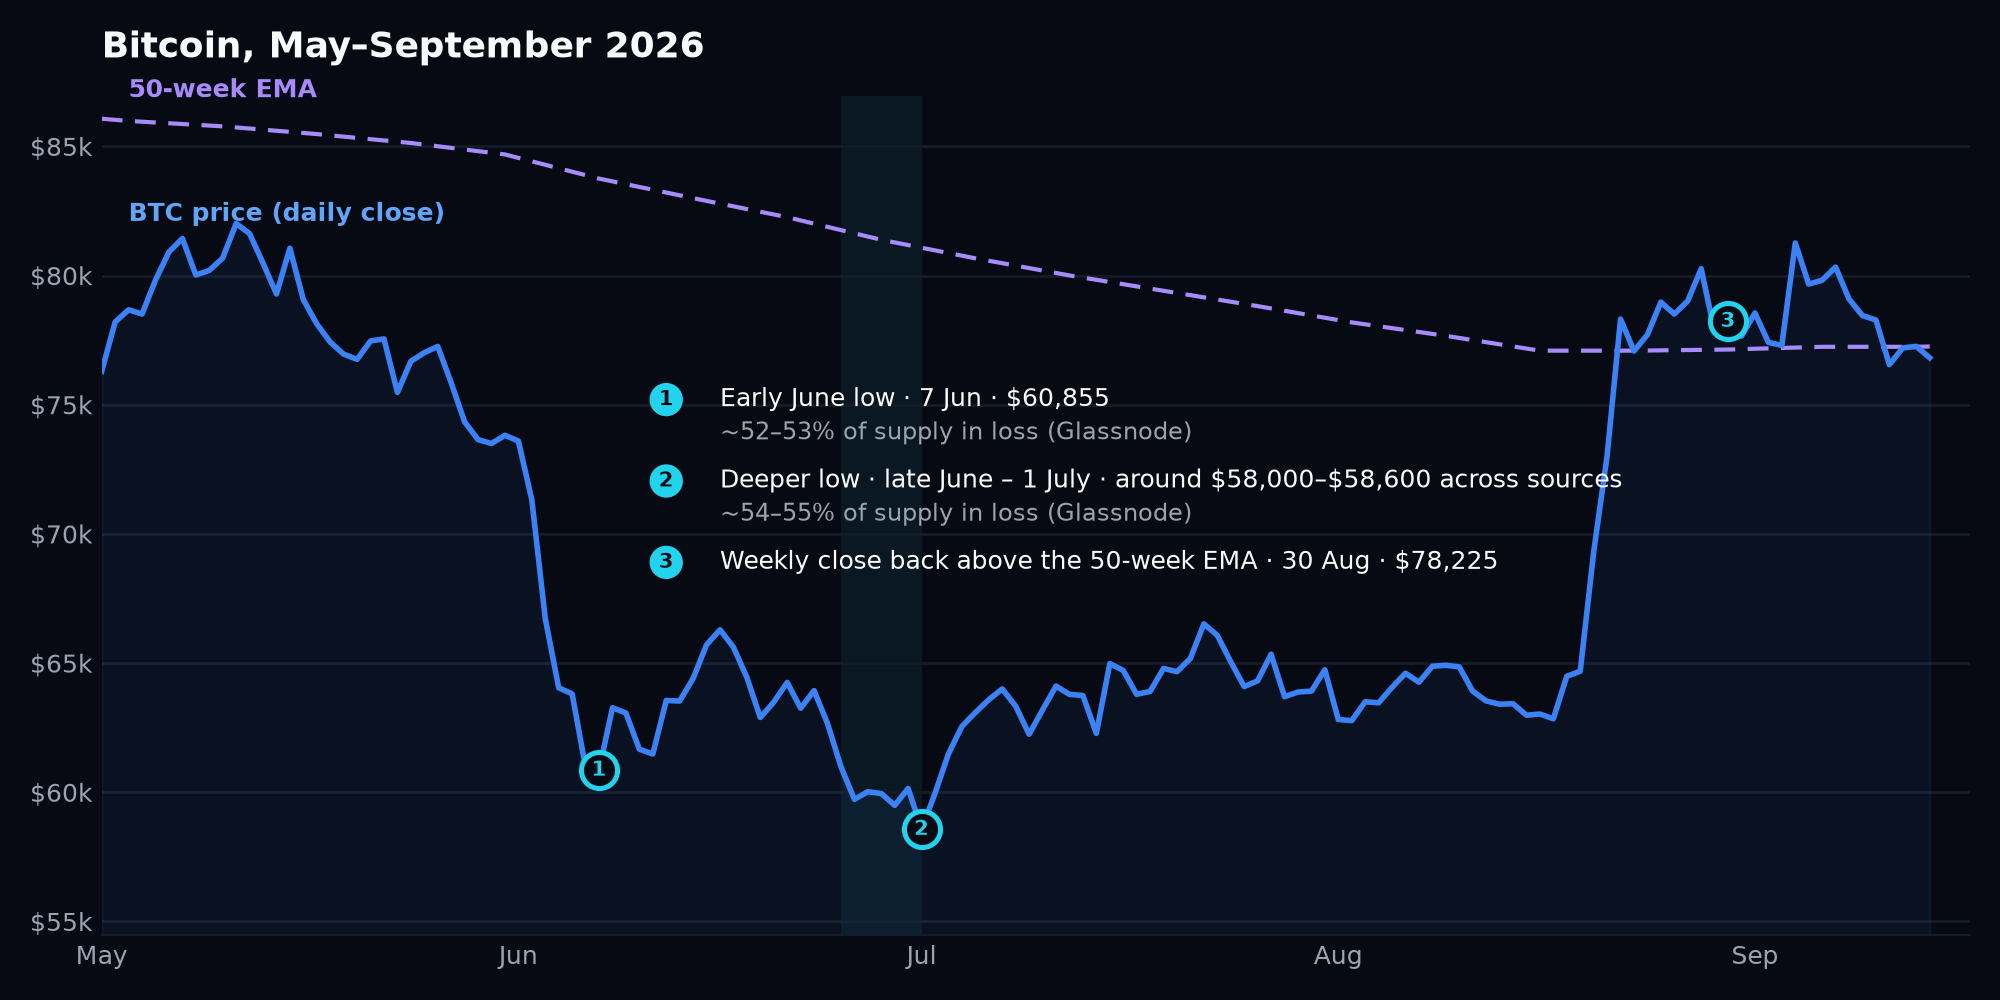
CoinDesk’s June 4 reporting lines up with the early threshold crossing and is useful corroboration: https://www.coindesk.com/markets/2026/06/04/this-bitcoin-metric-has-marked-every-bear-market-bottom-and-it-s-just-flashed-again/
Why it works (this is the part that matters)
This is not just a pattern someone noticed.
K33’s head of research (as quoted in published reporting) explains there is a mechanical ceiling. A large share of old coins never move. They are lost, or held by people with no intention of selling. Those coins never register as “in loss,” because their cost basis never updates.
That caps “supply in loss” in the rough 50% to 56% range across prior bear markets. https://nftplazas.com/bitcoin-underwater-supply-bottom-signal/
The caveat, and why the June sequence matters
In prior cycles, crossing the threshold has often arrived before one final leg lower.
That is exactly what the June 2026 sequence shows.
The threshold crossed in early June. BTC then made one more leg lower into the lows around $58,000 to $58,600 depending on the source.
So this is not a day-picker. It marks the zone.
How you use it
When supply in loss approaches this zone, stop assuming downside is infinite. Start asking what would force sellers to keep selling from here.
That does not mean price cannot fall. It means the supply dynamics are changing.
Indicator 2: Weekly oversold plus reclaim of the 50-week EMA (confirmation only)
This is my backtest. It is not a published benchmark.
I tested BTC weekly candles from Sep 2013 to Sep 2026, about 700 weeks. I used Wilder RSI(14) and a 50-week EMA.
Claim: After BTC goes oversold on the weekly and then reclaims its 50-week EMA, it has not made a lower low in the completed bear markets in the sample.
Results (RSI < 30 cutoff)
- 2015-01-18: low $209. Reclaimed 50-week EMA on 2015-07-12 at $310. +48%, 175 days later.
- 2022-11-27: low $16,465. Reclaimed on 2023-03-19 at $27,125. +65%, 112 days later.
2026 is the live case.
- 2026 low period: BTC printed its lows between early June and the first days of July, bottoming around $58,000 to $58,600 depending on the source. BTC reclaimed the 50-week EMA on 2026-08-30 at $78,225.
2018 depends on a cutoff
If I widen the RSI cutoff to below 32 instead of 30, 2018 qualifies:
- 2018-12-16: low $3,216. Reclaimed on 2019-04-21 at $5,304. +65%, 126 days later.
What weakens this signal (and why you should care)
- It confirms a low that is already 4 to 6 months old. It triggers at +30% to +65% above the low. It is confirmation, not bottom-finding.
- 2018 is sensitive to a cutoff. Weekly RSI bottomed at 30.2. Whether it “counts” turns on 0.2 in an arbitrary threshold.
- The EMA cross alone is worthless. There have been 18 upward crosses since 2013. Only 3 or 4 were preceded by oversold. The RSI filter carries the claim.
- Bitcoin has had three completed bear markets, ever. The sample is small.
2026: the sequence fired, time is the missing piece
The framework has done what it did in prior cycles.
Supply-in-loss crossed the threshold. Price made its final leg lower into the lows around $58,000 to $58,600 depending on the source. Weekly conditions went oversold. Then BTC reclaimed the 50-week EMA on Aug 30.
BTC is just over $75k late on Sep 15. That is roughly 30% above the lows.
That is the same “stress then confirmation” story this marker is supposed to tell. The only thing missing is time.
I still will not label it “no lower low” yet. That is a future claim, and this article is built around checkable work.
Indicator 3: Fear and Greed is not contrarian in my backtest
This is the finding that made me remove Fear and Greed from per-coin scoring in the product.
I backtested Fear and Greed data from 2018-02-01 to today. That is 3,145 days. I tested correlation of Fear and Greed versus forward BTC return.
Correlation vs forward BTC return
- 7 days: +0.083 (n=3,138)
- 30 days: +0.134 (n=3,115)
- 90 days: +0.217 (n=3,055)
- 365 days: -0.095 (n=2,780)
Under a year, it is positive at every horizon. The strongest positive is 90 days.
That is mild momentum. It is the opposite of “fear means buy.”
Only at 365 days does it go negative, and -0.095 is noise.
So the general contrarian reading is not supported by this dataset.
The narrow setup that does something
Fear and Greed at or below 10, while BTC is more than 50% below ATH.
Measured as “closest approach to the lowest close in the following 12 months”:
- 2018-02-06: closest approach 2.15x, miss
- 2018-11-25: 1.21x, hit
- 2020-03-14/28: 1.00x, hit
- 2022-05-14/17: 1.86x, miss
- 2022-06-14/21: 1.21x, hit
That is three of five. Eight consecutive days are one observation, not eight.
Weaknesses that matter:
- Three distinct bottoms in the dataset, and one is COVID. That is a liquidity crash, not a normal cycle bottom.
- The >50% drawdown filter is nearly decorative. In eight years there is exactly one sub-10 day that did not already have BTC more than 50% off its ATH.
- Sub-15 is loose and there is no gradient. Sub-15 ~61%, sub-20 50%, sub-25 58%, sub-30 60%, sub-40 57%. Flat. Only sub-10 separates, and sub-10 is 19 days in eight years.
Other published bottom-adjacent signals
These are widely-cited indicators. I’m listing them as context and linking to the reporting I used. I’m not presenting them as guaranteed bottom callers.
-
Realized price: https://www.coindesk.com/markets/2026/06/23/bitcoin-may-need-to-plunge-15-or-more-to-mark-bottom-according-to-this-long-time-indicator
-
50-week / 100-week MA crossover (archived): https://web.archive.org/web/20260418014539/https://www.coindesk.com/markets/2026/04/17/this-simple-indicator-has-called-every-bottom-since-2015-it-hasn-t-triggered-yet
The live test (June to early July 2026)
This is the part I care about.
Supply-in-loss crossed the threshold in early June. BTC then put in its lows between early June and the first days of July, bottoming around $58,000 to $58,600 depending on the source.
BTC is just over $75,000 late on Sep 15.
Either the zone mattered this cycle, or it didn’t. We get to find out in real time.
So how do you know when a bear market bottoms?
You don’t, in the sense people mean.
You can do something more realistic.
You can identify zones where stress is reaching a structural ceiling. You can recognize confirmation markers months later. You can stop using popular sentiment widgets as contrarian signals just because the story is convenient.
That is the edge here. It is not prediction. It is refusing to lie to yourself.
Where Cyclesolved fits
We score coins across technicals, on-chain, fundamentals, sentiment, and macro. You get one 0 to 100 score, and you can open it and see the inputs behind it.
Start here:
No ads. No calls. No hype. No paid coin promotions, ever.
Not financial advice. Educational only.
Get this in your inbox each morning
What changed today, emailed each morning: the scores that moved overnight, your watchlist changes, and what's rated Buy.
Double opt-in. Unsubscribe in one tap.
See this on real coins. Cyclesolved scores every coin in the top 100 across five categories and shows every input behind the number.