
Does the Crypto Fear and Greed Index work? Count episodes, not days
Updated 22 September 2026
Summary
I tested the alternative.me Crypto Fear and Greed Index against forward Bitcoin returns from 2018-02-01 to 2026-09-22.
My headline finding: counting days overstates what this index is telling you. Counting days treats a 95-day run as 95 independent signals. It is one.
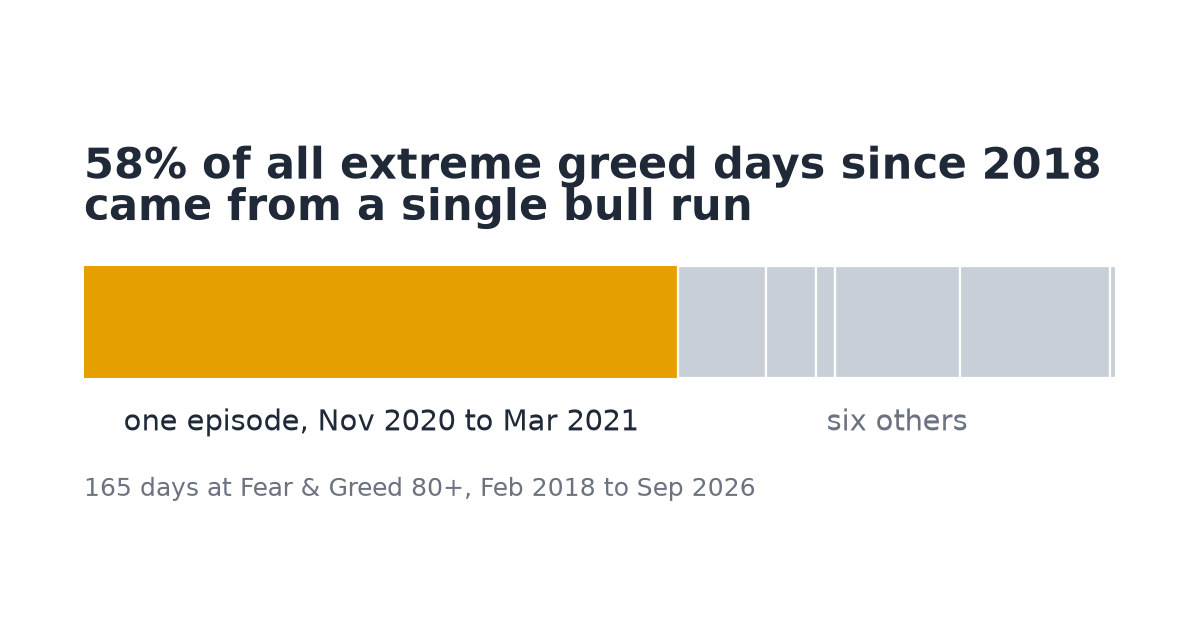
By day count, extreme greed (80+) looks wildly bullish: a +63.1% average BTC return over the next 90 days. Remove one run, 2020-11-06 to 2021-03-09, and it falls to +0.1%.
My second finding: in every band, the median day and the median episode point in opposite directions at 90 days. When two reasonable ways of measuring the same index disagree on direction, it does not give a direction you can rely on.
The result that holds up best is extreme fear (F&G at or below 10) at 90 days. It is still not a rule. It is a tendency on 11 episodes.
The backtest results (90-day returns)
This table uses days with a complete 90-day window only. Those day counts sum to 3,062, not the full 3,152 index readings.
90-day forward BTC return by Fear & Greed band
| band | days | day-mean | day-median | episodes | ep-mean | ep-median | episodes positive |
|---|---|---|---|---|---|---|---|
| 0-19 | 341 | +3.5% | -2.6% | 18 | +8.1% | +4.3% | 11/18 |
| 20-39 | 976 | +3.0% | -6.1% | 16 | +17.1% | +16.0% | 10/16 |
| 40-59 | 806 | +20.8% | +8.1% | 25 | +6.6% | -9.9% | 11/25 |
| 60-79 | 774 | +14.1% | +4.1% | 16 | +5.5% | -7.4% | 7/16 |
| 80+ | 165 | +63.1% | +30.2% | 7 | +12.1% | -4.2% | 3/7 |
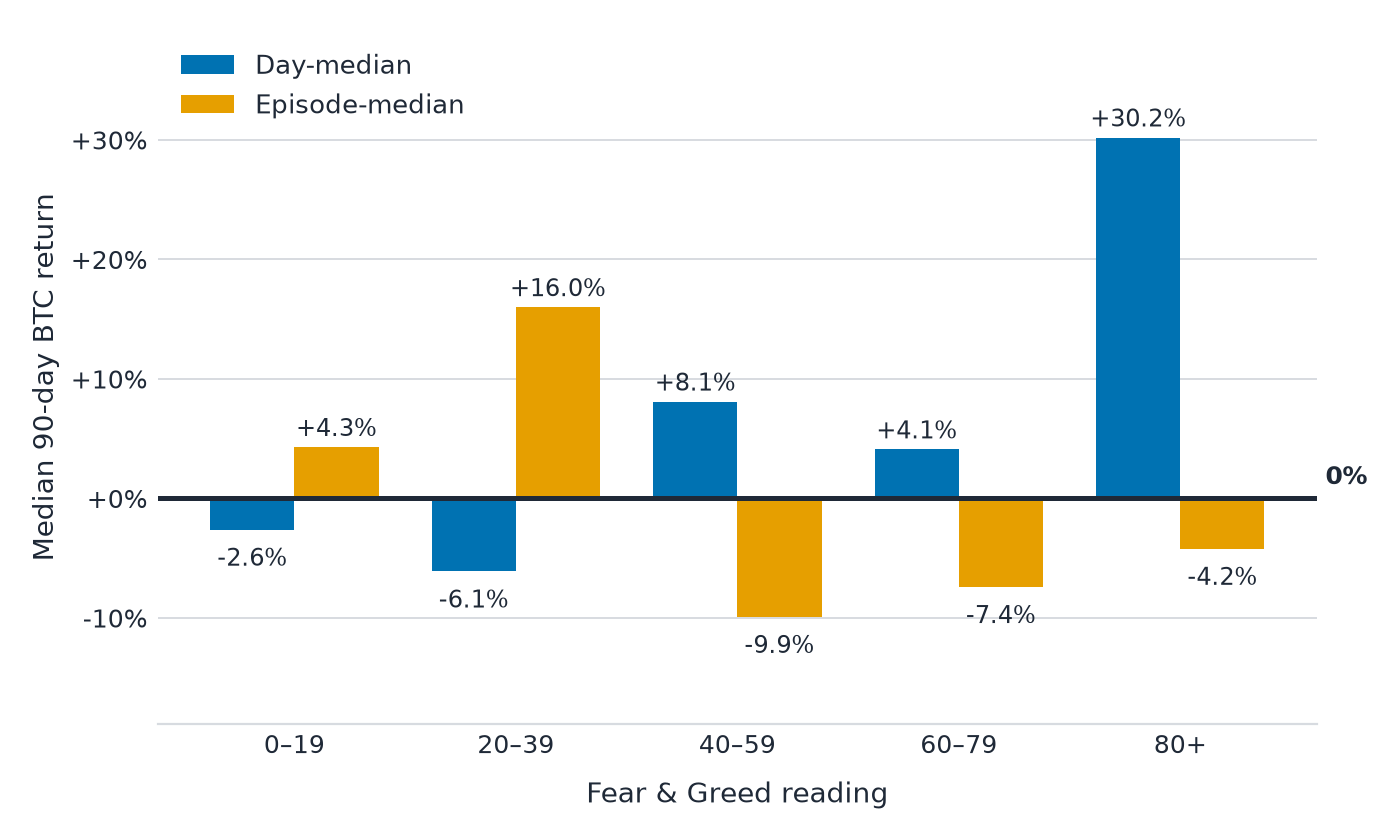
How to read this table
- Days treat every day as a new datapoint.
- Episodes treat each independent market event once.
Key reads:
- 80+ drops from +63.1% (day-mean) to +12.1% (episode-mean), a 51-point drop with the statistic held constant.
- The 80+ day-median is also high (+30.2%), so this is not a few outlier days. The gains are concentrated in time.
- In three of the five bands (40-59, 60-79 and 80+) the episode mean and the episode median have opposite signs. With 7 to 25 episodes per band, one large episode is enough to drag a mean across zero.
- Episode medians are positive for both fear bands (0-19 and 20-39) and negative for all three bands from 40 up. Treat that as a lean, not a signal. Samples range from 7 to 25 episodes per band.
Why day counts mislead: one episode dominates extreme greed
Day-level statistics can be dominated by a single sustained run.
Concentration in one episode (90-day day-mean):
- F&G >= 80: +63.1% with all days. +0.1% without its largest episode by day count (2020-11-06 to 2021-03-09, 95 of 165 days, 58%).
- F&G >= 90: +95.4% with all days. -5.9% without its largest episode by day count (2020-11-06 to 2021-02-23, 65 of 72 days, 90%).
Counting days treats that long run as dozens of independent signals. It is one.
Day-level and episode-level results disagree on direction
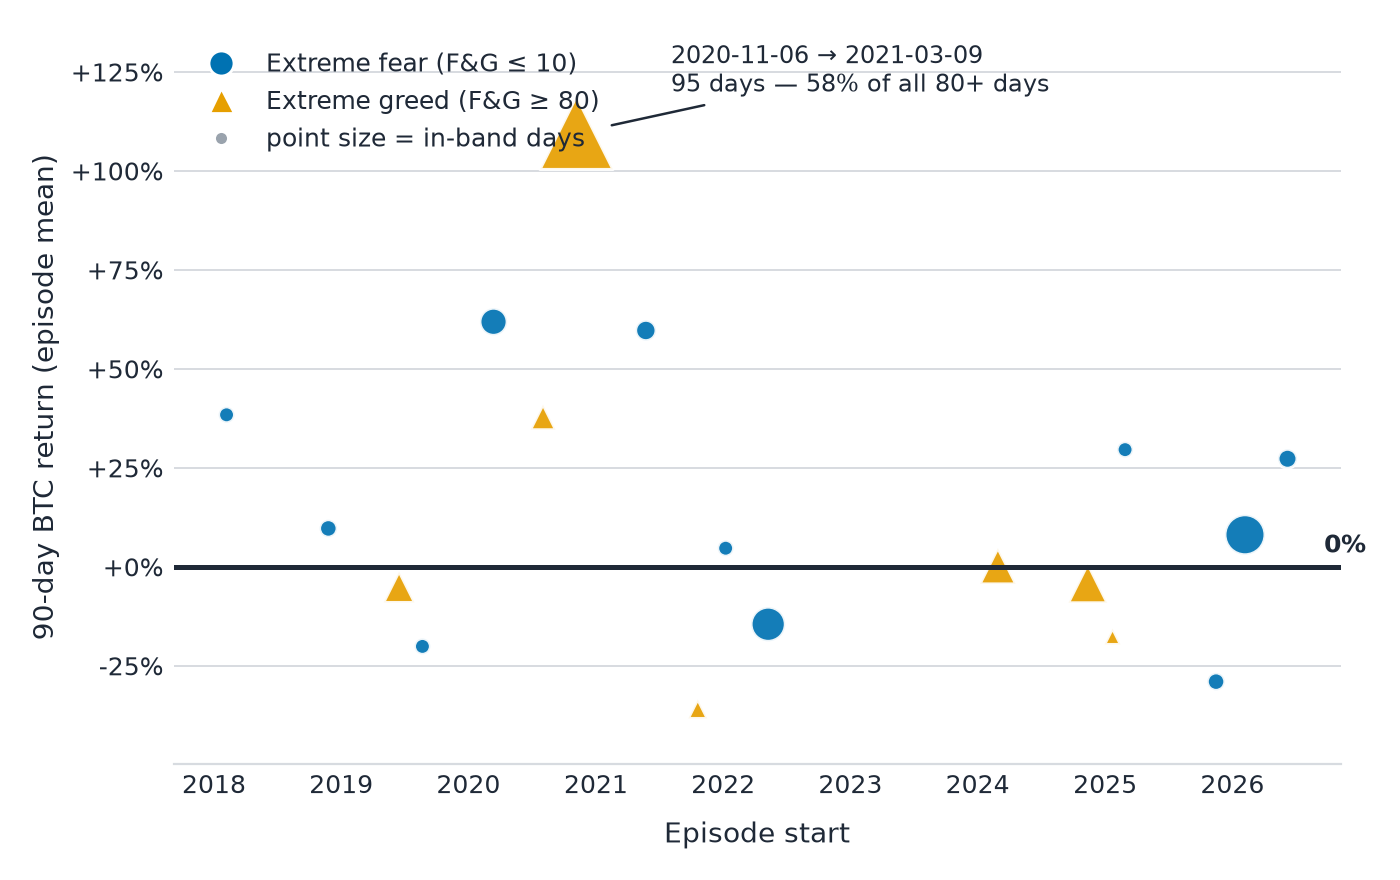
In every band, the median day and the median episode point in opposite directions at 90 days.
- 0-19: day-median -2.6% vs episode-median +4.3%
- 20-39: day-median -6.1% vs episode-median +16.0%
- 40-59: day-median +8.1% vs episode-median -9.9%
- 60-79: day-median +4.1% vs episode-median -7.4%
- 80+: day-median +30.2% vs episode-median -4.2%
I do not need a theory to interpret that. If your conclusion depends on whether you count days or episodes, the signal is not stable.
Does extreme greed mark a top?
I tested a simple definition: "marked a top" means no close above the episode's peak within the following 365 days.
- F&G >= 80: 2 of 7 episodes (2019-06-16 to 2019-07-10, and 2021-10-20 to 2021-11-09).
- F&G >= 90: 1 of 4 episodes (2019-06-26 to 2019-06-27).
"Extreme greed marks tops" does not hold up in this dataset.
Is extreme greed "overheated"?
I looked at the max drawdown over the following 90 days.
- All days (n=3,062): median -13.9%. 43% of days saw worse than -17%.
- F&G >= 80 (n=165): median -6.1%. 22% saw worse than -17%.
This looks like "greed is safer." It is not that clean.
All 165 days at 80+ (and all 72 at 90+) were above BTC's 200-day moving average. Zero were below. Over all 3,152 index days, BTC was 52.5% above and 47.5% below its 200-day moving average.
So "greed is followed by gains" and "greed is followed by shallow drawdowns" are partly circular. Extreme greed happens in uptrends. Conditioning on extreme greed conditions on an uptrend.
The mirror image: 67 of 69 days at F&G <= 10 (97.1%) were below the 200-day moving average.
Changes in Fear and Greed predict nothing
I tested the Fear and Greed level and its changes against forward BTC returns. Sample sizes differ by horizon because I only use complete return windows.
Correlation with forward BTC return
| predictor | 7d | 30d | 90d | 365d |
|---|---|---|---|---|
| F&G level | +0.085 (n=3145) | +0.134 (n=3122) | +0.216 (n=3062) | -0.095 (n=2787) |
| 1-day change | +0.029 (n=3144) | +0.008 (n=3121) | +0.013 (n=3061) | +0.008 (n=2786) |
| 7-day change | +0.053 (n=3138) | +0.019 (n=3115) | +0.044 (n=3055) | +0.013 (n=2780) |
- The level shows mild momentum under a year. The sign flips at a year. That itself is a sign of instability.
- Changes in Fear and Greed are indistinguishable from zero at every horizon.
Stability by year
This is another way to see why day counting misleads. The extreme greed sample exists in only five years, and one year supplies the result.
90-day forward mean by year (n = days)
| year | all days | F&G<20 (n) | F&G>=80 (n) |
|---|---|---|---|
| 2018 | -18.0% | -10.3% (79) | none |
| 2019 | +31.7% | +10.3% (19) | -5.1% (14) |
| 2020 | +64.8% | +44.1% (43) | +149.8% (64) |
| 2021 | +5.5% | +40.0% (21) | +24.2% (42) |
| 2022 | -9.6% | -15.1% (73) | none |
| 2023 | +25.4% | none | none |
| 2024 | +18.8% | +27.2% (1) | -2.2% (44) |
| 2025 | -3.0% | -13.5% (22) | -17.6% (1) |
| 2026 | -3.8% | +5.2% (83) | none |
- 2018 starts Feb 1.
- 2026 is partial. Its 90-day windows end mid-June.
- Don't lean on years with n=1.
What holds up best: extreme fear (F&G at or below 10)
Extreme fear is rare by day count and small by episode count. Of the extremes I tested (F&G >= 80, F&G >= 90 and F&G <= 10), it is the only one whose 90-day result is not carried by a single episode.
- 69 days, 11 episodes, all with complete 90-day windows.
- 90 days: 8 of 11 episodes positive. Episode mean +16.0%, median +9.7%.
- Remove the largest episode (2026-02-06 to 2026-04-03, the longest at 26 days by day count, not by return) and the mean is essentially unchanged at +16.8%. The median rises to +18.5%, but that is mostly an artifact of taking a median on ten values. What matters is that nothing here rests on one event, which is the opposite of what happens to the greed bands.
The caveats matter:
- 365 days: only 8 episodes have complete windows. 4 positive, median -5.2%.
- The 365-day mean is +108.3%, but that is almost entirely the COVID crash episode (+891.9%). I don't treat that mean as representative.
How I read it:
- Among the extremes, this is the result that holds up best at 90 days.
- It is still 11 events, in a period dominated by a long bull market. That is exactly when buying fear looks good.
- It is a tendency worth knowing, not a trading rule.
If you say "sub-10," state the threshold. F&G <= 9 occurred on 42 days. F&G <= 10 occurred on 69 days.
Deep capitulation: extreme fear plus a 50% drawdown filter
This filter does real work. It changes which events qualify.
I am not going to state a hit ratio here. With 5 closed episodes, the count flips depending on whether you measure the 365-day return from an episode's first day or average it across the episode's days. Example: 2022-05-10 to 2022-06-28 is -11.3% from its first day and +9.4% as an episode average.
Instead, here are the qualifying episodes (F&G <= 10 while BTC is more than 50% below its all-time high) and their outcomes:
- 2018-02-06 (1 day): -64.8% drawdown. 365d -49.9%
- 2018-11-25 to 2018-12-14 (2 days): -83.3%. 365d +99.5%
- 2020-03-13 to 2020-04-12 (10 days, COVID crash): -74.3%. 365d +891.9%
- 2021-05-24 to 2021-07-21 (4 days): -53.0%. 365d -21.9%
- 2022-05-10 to 2022-06-28 (18 days): -71.8%. 365d +9.4%
- 2026-06-08 to 2026-06-10 (3 days): -50.6%. 365d not yet available
Threshold sensitivity:
- 2026-06 qualifies at -50.6%.
- 2026-02-06 to 2026-04-03 (-49.7%) and 2019-08-22 (-48.3%) just miss.
- 6 of the 11 extreme fear episodes qualify, so the drawdown filter is selecting meaningfully.
Stated plainly: deep capitulation readings have been followed by some of the best years in the data and some of the worst. The sample is too small to call it a signal.
Note: our earlier article, Bitcoin Bear Market Bottom Indicators, reported a "three of five" result using a price series that missed the Dec 2017 high. Correcting the all-time high changes which episodes qualify, and the ratio depends on how returns are measured. This study supersedes that figure.
Methodology
I kept this simple and explicit so you can reproduce it.
Data sources and date range
- Index: alternative.me Crypto Fear and Greed, 2018-02-01 to 2026-09-22. 3,152 daily readings, 4 days missing from the index. Feb 2018 is where the index's own history begins.
- Price: CoinGecko BTC daily closes.
- I extended the BTC price history back to 2013-04-28 so the all-time high and 200-day moving average are correct from the first Fear and Greed day. The all-time high before the index begins was $19,665 on 2017-12-16.
Forward return windows
- Forward returns use complete windows only. This is why sample sizes differ by horizon.
- Example: the 90-day band table uses 3,062 days because those are the days with complete 90-day windows.
Episode definition
I count both days and independent episodes.
An episode is a run of consecutive days whose Fear and Greed reading falls in the band. Two runs separated by 30 days or fewer merge into one episode, so a reading that leaves the band for a week and returns counts as one market event, not two.
- An episode's return is the average of the forward returns of its in-band days, each measured from that day's own close. Off-band days between merged runs are not counted.
- An episode's date range can span more calendar days than its day count.
Why I did not extend the index history
I looked for a longer proxy (Google Trends, put/call ratio, social volume). None measures the same thing, so I did not splice one in.
What this means for Cyclesolved
We removed Fear and Greed from per-coin scoring because of this research. We still show the raw number, with no "Extreme Greed" or "Extreme Fear" label, because the label implies a signal the data does not support. Market regime on Cyclesolved now comes from equity direction alone, not equities plus sentiment. Every input behind every Cyclesolved score is published so you can check the work.
Related reads
If you are using indicators, you also need clean definitions and clean denominators:
FAQ
Does the crypto Fear and Greed Index work?
Not as a direction you can rely on in this backtest. At 90 days, in every band, the median day and the median episode point in opposite directions, so the conclusion depends on how you measure it.
Is extreme fear a buy signal for Bitcoin?
It is a tendency, not a rule. At 90 days, 8 of 11 extreme fear episodes (F&G <= 10) were positive, with an episode mean of +16.0% and median of +9.7%. At 365 days the median is -5.2% on the 8 episodes with complete windows.
Is extreme greed a bullish signal?
Not in a stable way. By day count, F&G >= 80 shows a +63.1% average 90-day return, but that falls to +0.1% if you remove its longest episode, and the episode-level median is negative (-4.2%).
Does extreme greed mark the top?
Not reliably. Using "marked a top" as no close above the episode peak within 365 days, F&G >= 80 marked a top in 2 of 7 episodes, and F&G >= 90 in 1 of 4.
Do changes in Fear and Greed predict returns?
No. The correlation of 1-day and 7-day changes with forward BTC returns is near zero at every horizon tested (for example, the 1-day change is +0.013 at 90 days, n=3061).
Not financial advice. Educational only.
Get this in your inbox each morning
What changed today, emailed each morning: the scores that moved overnight, your watchlist changes, and what's rated Buy.
Double opt-in. Unsubscribe in one tap.
See this on real coins. Cyclesolved scores every coin in the top 100 across five categories and shows every input behind the number.